
Learn essential candlestick patterns for scalping, including entry/exit strategies, volume analysis, and effective risk management techniques.
Scalping is all about making quick profits from small price changes. Candlestick patterns can help you identify entry and exit points fast. Here’s what you need to know:
- Top Patterns to Know: Doji, Engulfing, Hammer, Star Patterns, and Three Black Crows.
- Best Timeframes: Use 1-minute for fast trades, 5-minute for balance, and 15-minute for trend confirmation.
- Volume Matters: Patterns like Engulfing are most reliable with 2–3× average volume.
- Tools to Simplify: Use exclusive tools from LuxAlgo’s Price Action Concepts toolkit for real-time pattern detection.
Combine these patterns with stop-loss strategies and volume analysis for better results. Scalping isn’t just about speed – it’s about precision. Let’s dive deeper into how these patterns work.
Reading Candlestick Charts
Candlestick Components
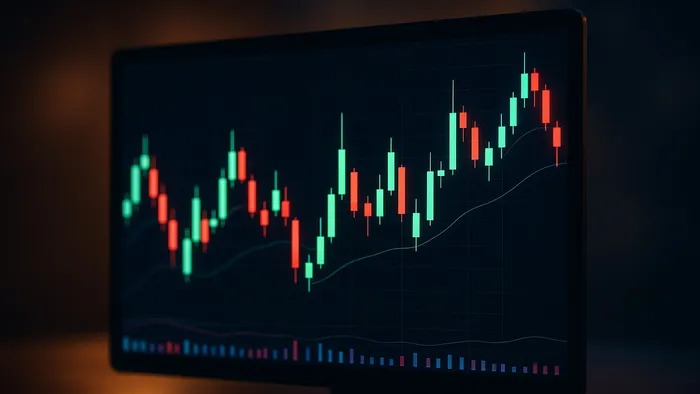
Candlesticks provide key price data at a glance: the body represents the open and close prices, while the shadows (or wicks) show the high and low prices. A green body indicates the price closed higher than it opened (bullish movement), while a red body shows the price closed lower than it opened (bearish movement).
The size and color of the candlestick reveal market trends. For example, long green bodies suggest strong buying activity, while long red bodies point to heavy selling pressure. Long upper shadows often indicate profit-taking, whereas long lower shadows suggest buyers stepping in.
“Each candlestick is a simple, yet powerful tool to understand what's happening in the market.” – Steve Nison
Understanding these basics is crucial when deciding on the right timeframe for scalping.
Best Timeframes for Scalping
Once you grasp candlestick fundamentals, selecting the appropriate timeframe becomes critical for scalping success. Different timeframes cater to various trading strategies:
| Timeframe | Best Use Case | Market Conditions |
|---|---|---|
| 1-minute | High-frequency scalping | High volatility, liquid markets |
| 5-minute | Balanced trading | Moderate volatility |
| 15-minute | Trend confirmation | Support/resistance validation |
The 1-minute chart is ideal for fast-paced, volatile markets, offering plenty of trading opportunities. The 5-minute chart strikes a balance, filtering out noise while maintaining a steady trade flow.
Using multiple timeframes can improve accuracy:
- Primary Trading Chart: Use 1-minute or 5-minute charts for pinpointing entry and exit signals. These shorter timeframes are perfect for capturing quick price movements, especially in volatile conditions.
- Confirmation Chart: A 15-minute chart helps validate trends and identify key support and resistance levels. This reduces the risk of false signals common in shorter intervals.
Your choice of timeframe should match the market's volatility. Shorter intervals work well during high-volatility periods, while longer intervals are better suited for moderate volatility, providing clearer signal confirmation.
Top Candlestick Patterns for Scalping
Doji Patterns
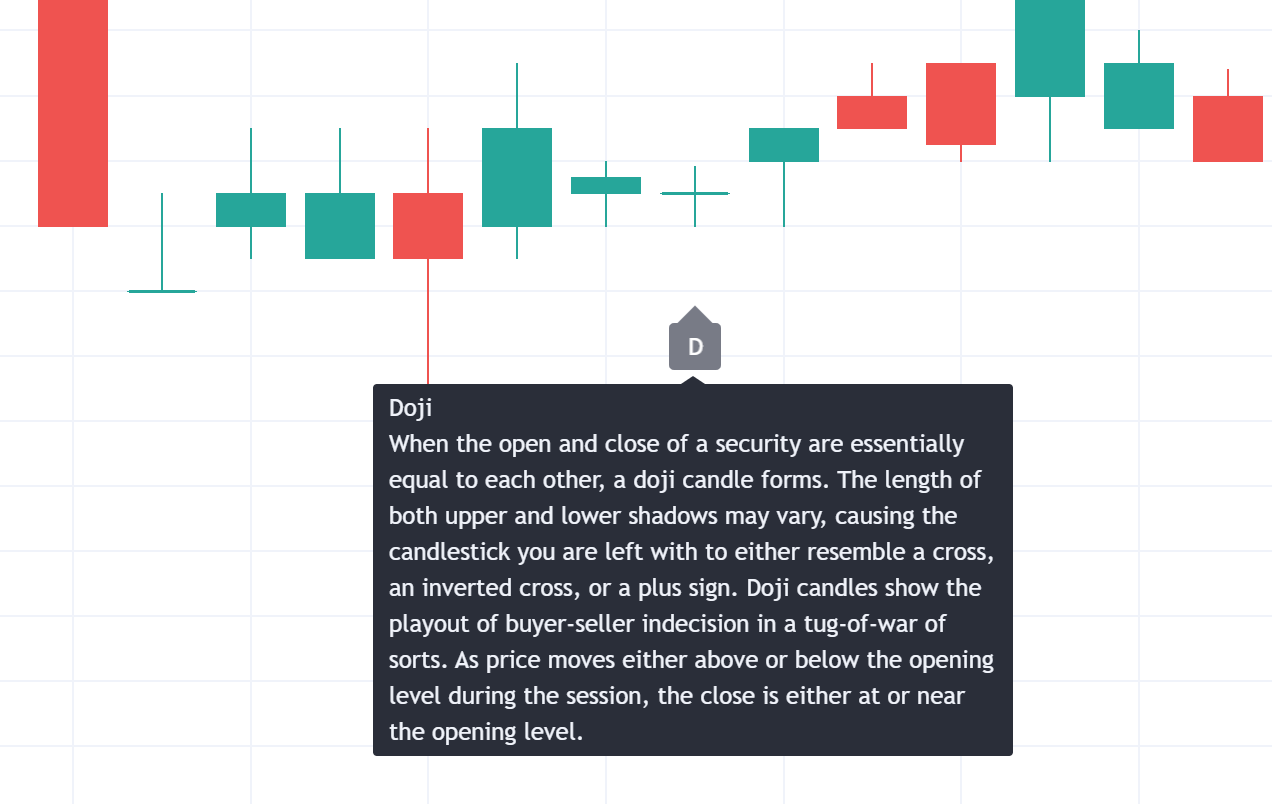
Doji patterns form when a security's opening and closing prices are almost the same, creating a cross-like shape. These patterns indicate indecision in the market and often suggest possible trend reversals, especially after a strong trend.
| Doji Type | Market Signal | Best Trading Conditions |
|---|---|---|
| Standard Doji | Neutral bias, market indecision | High volume, trend exhaustion |
| Dragonfly Doji | Bullish after a downtrend | Support levels, high volatility |
| Gravestone Doji | Bearish after an uptrend | Resistance levels, strong volume |
| Long-legged Doji | Extreme uncertainty | Major price levels, high volatility |
These patterns are crucial for identifying shifts in market sentiment. Up next: engulfing patterns and their role in spotting reversals.
Bullish and Bearish Engulfing
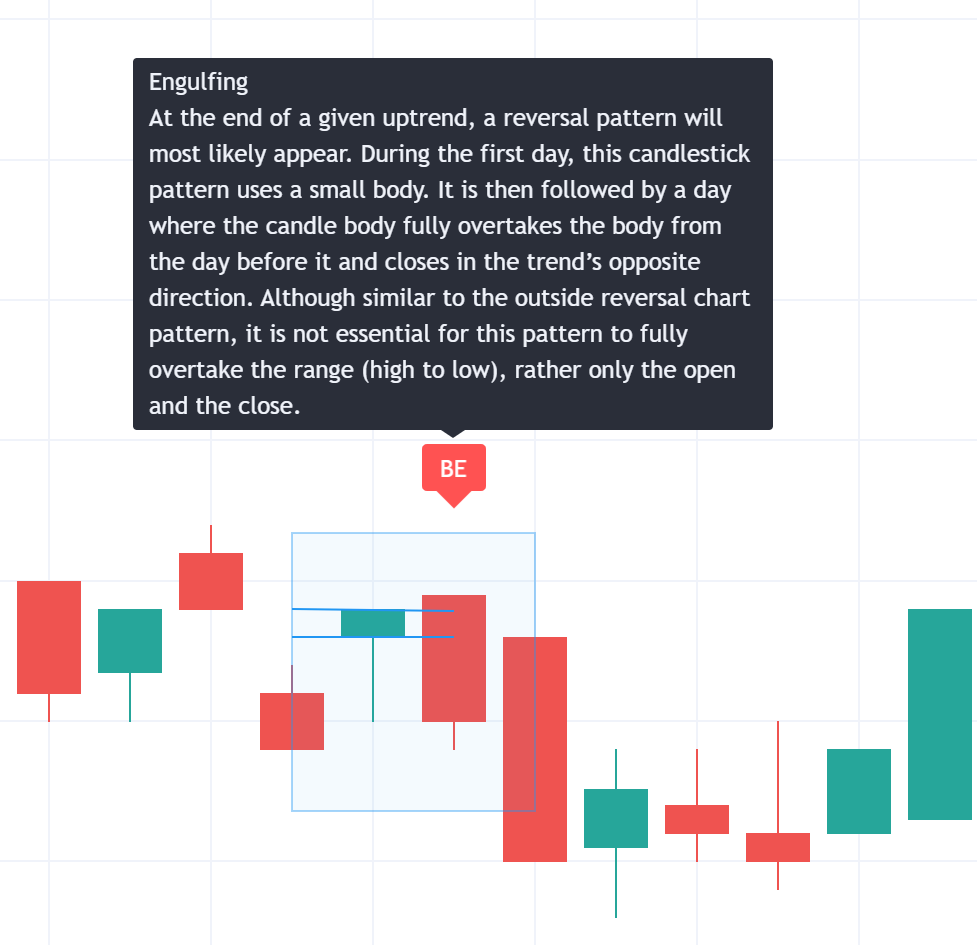
Engulfing patterns are key reversal signals. They occur when one candle completely covers the body of the previous candle, reflecting a sudden change in market sentiment. A bullish engulfing pattern happens when a green candle fully engulfs the prior red candle, signaling a potential upward reversal. On the other hand, a bearish engulfing pattern forms when a red candle completely engulfs the previous green candle, pointing to a likely downward trend shift.
Hammer Patterns
Hammer patterns are single-candle formations that often indicate reversals. These candles have a small body positioned at the upper end of the trading range and a long lower shadow, which is usually at least twice the length of the body. Hammers are most effective when they appear:
- At the bottom of downtrends
- Near key support levels
- Alongside increased trading volume
- During periods of high market activity
These factors help validate the hammer pattern's reversal signal. Star patterns offer another way to confirm potential market shifts.
Star Patterns
Morning and evening stars are three-candle formations that often signal reversals and can precede significant price moves. These patterns consist of three candles and are especially useful for confirming earlier reversal signals.
Three Black Crows Pattern
The Three Black Crows pattern features three consecutive red candles, each closing lower than the last. It’s a reliable indicator when:
- Each candle opens within the previous candle's body
- Volume increases with each candle
- The pattern forms after an uptrend
- It appears near key resistance levels
This pattern works well when paired with precise stop-loss strategies and complements other scalping methods.
When applying these candlestick patterns for scalping, combine them with other technical tools and volume analysis for better accuracy. Strong market volume and clear trend conditions significantly improve their reliability.
Using Patterns in Scalp Trading
Entry and Exit Points
Scalping requires precise timing for both entering and exiting trades. Candlestick patterns, supported by volume and other indicators, act as reliable signals in fast-moving markets. For example, an engulfing candle paired with a volume spike is a strong signal. Meanwhile, hammer and doji patterns provide slightly less confirmation but are still useful. Always wait for the pattern to fully form before acting – this helps reduce the chances of false signals.
| Pattern Type | Volume Characteristics | Confirmation Strength |
|---|---|---|
| Engulfing Candles | 2–3× above average volume | Very High |
| Hammer/Shooting Star | Noticeable volume spike | High |
| Doji | Gradual volume build-up | Moderate |
This table highlights the importance of volume in confirming entry signals. Once you’ve identified a valid entry, the next step is to safeguard your trade.
Setting Stop-Loss Orders
After confirming an entry signal, place stop-loss orders at key levels indicated by the pattern. For bullish setups like engulfing patterns, position the stop-loss just below the pattern's low. For bearish setups, place it just above the high. In the case of hammer patterns, set the stop-loss just below the lower shadow to protect against potential reversals.
Pattern Detection with LuxAlgo’s Price Action Concepts toolkit
Automating pattern detection can make your trading more efficient. LuxAlgo’s Price Action Concepts toolkit offers real-time alerts to simplify your process. Key benefits include:
- Real-time identification of patterns across various timeframes
- Custom alerts for specific patterns you’re watching
- Integrated volume analysis to confirm signals
- Instant trade notifications through built-in alert systems
This automation works alongside manual pattern recognition, improving both speed and accuracy in your trading decisions.
Strengths and Weaknesses of Pattern Trading
Benefits
Pattern trading provides quick signals, making it a useful approach for scalpers working in fast-paced markets. Candlestick patterns, especially when combined with volume analysis, help traders gauge market sentiment and spot potential reversals. Their visual nature makes them easy to recognize, allowing for faster decision-making.
Volume spikes often confirm these patterns, adding confidence to trades. Analyzing multiple timeframes can also validate short-term decisions by aligning them with broader trends, which helps filter out unnecessary market noise and focus on higher-probability setups.
That said, this method has its limitations.
Drawbacks
The subjective nature of pattern interpretation can lead to mixed signals. In markets with high volatility or low liquidity, false signals become more common, increasing the risk of losses. Relying solely on candlestick patterns is rarely enough for consistent success. To improve outcomes, traders should combine these patterns with technical indicators, fundamental analysis, and an understanding of overall market sentiment.
Being aware of both the strengths and weaknesses of pattern trading is essential for developing a well-rounded scalping approach.
Pattern Trading Overview
Scalping with pattern trading requires balancing quick signal generation with its potential downsides. Here's a breakdown of the trade-offs:
| Aspect | Pros | Cons |
|---|---|---|
| Signal Generation | Quick visual identification | Open to subjective interpretation |
| Market Context | Shows immediate sentiment | May overlook the bigger picture |
| Implementation | Simple to automate | Can produce false signals |
| Risk Management | Helps set stop-loss levels | Sensitive to sudden market shifts |
| Time Efficiency | Allows real-time analysis | Demands constant monitoring |
Candlestick patterns offer useful insights when paired with other tools and a solid understanding of the market. Successful scalpers treat these patterns as part of a larger strategy, integrating them with other analyses to refine trade decisions and manage risks effectively.
Top 5 Candlestick Patterns Every Trader MUST Master
Conclusion
Understanding candlestick patterns is a crucial part of successful scalping. Some patterns are particularly reliable. For example, the Three Black Crows pattern has a 78 % success rate in confirming downtrends, while the Three Outside Up pattern signals bullish reversals 70 % of the time.
But relying solely on pattern recognition isn’t enough. Effective scalping requires combining pattern analysis with solid technical tools and careful risk management. Volume plays a big role here – patterns like engulfing ones are most reliable when volume is 2–3 × the average.
Tools like LuxAlgo’s Price Action Concepts toolkit can simplify this process by automating pattern detection across multiple timeframes. This is especially valuable in a market where the majority of day traders – 97 % – historically face losses.
Here’s a quick look at some of the most consistent candlestick patterns and their success rates:
| Pattern Type | Success Rate | Best Use Case |
|---|---|---|
| Three Black Crows | 78 % | Confirming strong downtrends |
| Three Outside Up | 70 % | Spotting bullish reversal signals |
| Evening Star | 68 % | Identifying top reversals |
| Morning Star | 65 % | Confirming bottom reversals |
FAQs
How can I use candlestick patterns like Doji and Engulfing to make better scalping decisions?
Candlestick patterns like Doji and Engulfing can help scalpers make quicker, more accurate trading decisions by signaling potential market reversals or momentum shifts.
- A Doji pattern, which shows market indecision, often signals an upcoming price movement. On short timeframes (like 1-minute or 5-minute charts), a Dragonfly Doji may indicate bullish momentum, while a Gravestone Doji could suggest a bearish reversal.
- Engulfing patterns are also key. A Bullish Engulfing pattern, where a small red candle is followed by a larger green candle, can signal a potential upward trend. Conversely, a Bearish Engulfing pattern, where a small green candle is followed by a larger red candle, may indicate a downward trend.
For added confidence, combine these patterns with tools like moving averages, Bollinger Bands, or the Relative Strength Index (RSI) to validate your trades. Understanding and applying these patterns effectively can help you improve timing and precision in fast-paced scalping scenarios.
How does trading volume confirm candlestick patterns, and how can I use it effectively in scalping?
Trading volume is a key factor in confirming candlestick patterns because it shows the strength and commitment behind price movements. When a pattern forms with high volume, it’s more likely to signal a strong and reliable trend. Patterns forming with low volume have less momentum and reliability.
To use volume effectively in scalping:
- Watch for rising volume during breakouts, as this confirms strong buying or selling pressure.
- Look for volume spikes near support or resistance levels, which can signal potential reversals.
- Use tools like Volume-Weighted Average Price (VWAP) or On-Balance Volume (OBV) to track volume trends and identify precise entry and exit points.
For example, if a price moves above VWAP with increasing volume, it’s often a strong signal to enter a trade. By combining volume analysis with candlestick patterns, you can improve accuracy and timing in your scalping strategy.
How can LuxAlgo help scalpers identify candlestick patterns and make faster trading decisions?
LuxAlgo’s Price Action Concepts toolkit automates real-time detection of key candlestick patterns across multiple timeframes, pairs them with integrated volume analysis, and delivers instant alerts. This speeds up decision-making, reduces manual charting time, and helps scalpers act on high-probability setups more efficiently.


