
Learn essential day trading strategies, risk management techniques, and tools to enhance your trading skills for better market performance.
Day trading means buying and selling stocks or other assets within the same day to profit from quick price changes. It’s risky, requires skill, and isn’t for everyone. Here’s what beginners need to know:
- What You’ll Need: At least $25,000 (due to PDT rules), a reliable computer, fast internet, and platforms like TradingView or ThinkorSwim.
- Key Skills: Learn technical analysis, risk management, and trading psychology.
- Popular Strategies:
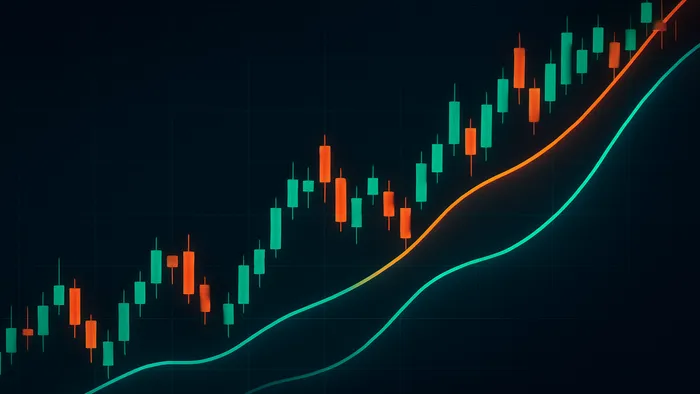
- Trend Trading: Follow price trends using moving averages and stop-loss orders.
- Momentum Trading: Trade during high-activity periods like market openings, focusing on strong price moves.
- Breakout Trading: Enter when prices break key levels, confirmed by volume spikes.
- Risk Management: Limit risk to 1–2% per trade, use stop-loss orders, and keep emotions in check.
- Getting Started: Brokers such as Interactive Brokers or TD Ameritrade, plus demo accounts for practice.
Quick Comparison:
| Aspect | Day Trading | Swing Trading | Long-Term Investing |
|---|---|---|---|
| Duration | Hours to 1 day | Days to weeks | Months to years |
| Analysis | Technical patterns | Market trends | Fundamental value |
| Time Commitment | Full-time | Part-time possible | Minimal |
| Capital Needed | High ($25,000+) | Moderate | Low |
| Risk Exposure | No overnight risk | Multi-day exposure | Long-term exposure |
Most day traders lose money, and success requires discipline, practice, and continuous learning. Start small, test strategies in demo accounts, and always manage risk. Ready to dive in? Let’s break it down step by step.
Price Action Trading Strategy Extended Crash Course
Basic Trading Methods
Day traders often use three effective methods to identify and act on market opportunities.
Following Market Trends
Trend trading focuses on price movements in a clear direction. Here's how to approach it:
- Use multiple timeframes, such as 15-minute and 1-hour charts, for better context.
- Enter trades during pullbacks to align with the trend.
- Set profit targets near resistance levels.
- Place stop-loss orders below recent swing lows to limit risk.
For a more structured approach, consider this guide for different trend types:
| Trend Type | Entry Signal | Stop-Loss | Take Profit |
|---|---|---|---|
| Uptrend | Price above 20 EMA with higher lows | Below recent swing low | At the previous high |
| Downtrend | Price below 20 EMA with lower highs | Above recent swing high | At the previous low |
| Sideways | Wait for breakout confirmation | Outside consolidation | 1:1 risk-reward ratio |
Trading Price Movement
This method takes advantage of strong market moves during high-activity periods:
- Pre-market hours (8:00–9:30 AM EST)
- Market opening (9:30–10:30 AM EST)
- Power hour (3:00–4:00 PM EST)
Key factors to consider:
- Volume: Look for spikes 2–3× higher than average.
- Price Action: Focus on moves with minimal wicks for strong momentum.
- Duration: Momentum trades typically last 5–15 minutes.
Trading Price Breakouts
Breakout trading involves entering positions when the price moves beyond key levels during high-volume periods. Here's what to watch for:
- Level Identification: Levels tested multiple times.
- Volume Confirmation: ≥ 50% above the 5-day average.
- Entry Management: Enter after a candle closes beyond the level.
| Breakout Type | Entry Criteria | Initial Stop | Target |
|---|---|---|---|
| Support Break | Close below support with increased volume | Above the breakdown candle | Previous support – ATR |
| Resistance Break | Close above resistance with increased volume | Below the breakout candle | Previous resistance + ATR |
| Range Break | Close outside the range with volume | Inside the range edge | Range height projected |
Chart Analysis Tools
Technical tools help traders identify entry, exit, and risk points with precision.
Price Patterns Guide
Chart patterns reveal market sentiment and can help predict price movements.
| Pattern Type | Recognition Points | Signal |
|---|---|---|
| Double Top | Two peaks at similar price levels | Bearish reversal when price breaks below the neckline. |
| Double Bottom | Two troughs at similar price levels | Bullish reversal when price breaks above the neckline. |
| Bull Flag | Parallel downward channel after an uptrend | Bullish continuation after a breakout. |
| Head & Shoulders | Three peaks, with the middle peak highest | Bearish reversal when the neckline is broken. |
Combine these patterns with volume analysis for better accuracy.
Main Trading Indicators
Moving Averages (MA)
- 20-period EMA for short-term trends, 50-period SMA for intermediate, 200-period SMA for long-term.
Relative Strength Index (RSI)
- Watch overbought above 70 and oversold below 30. Spot divergence between RSI and price for reversals.
MACD (Moving Average Convergence Divergence)
- Standard settings (12, 26, 9). Focus on crossovers and use the histogram to gauge momentum.
Pair these with support and resistance levels to complete your analysis.
Price Levels Guide
Key Price Points
- Previous day's high and low
- Round numbers (e.g., $50, $100)
- Major moving averages
Trading Applications
- Buy near support, stops just below.
- Sell near resistance, stops just above.
- Confirm breaks by checking multiple timeframes.
Risk Control Methods
Day trading demands strict risk management to safeguard your capital. Balancing precise stop-loss strategies, calculated position sizes, and a disciplined mindset is essential.
Stop-Loss Placement
| Type | Description | Best Used When |
|---|---|---|
| Basic Stop | Fixed price exit point | Range-bound markets |
| Trailing Stop | Adjusts with price movement | Strong trends |
| Stop Limit | Executes at a set price | Liquid markets |
| Mental Stop | Manual exit decision | High volatility |
"I know where I'm getting out before I get in. Whenever I enter a position, I have a predetermined stop. That is the only way I can sleep." – Bruce Kovner
Trade Size Rules
Many day traders cap their risk at 1–2% of total capital per trade. For example, with a $5,000 account and a 1% risk limit ($50), buying shares at $50 with a $45 stop risks $5 per share, allowing a maximum of 10 shares.
Trading Psychology
A strong mindset is key. Manage fear and greed by:
- Viewing losses as learning experiences.
- Setting profit targets before entering trades.
- Ignoring market noise—focus on actionable data.
- Keeping a trading journal to review trades and emotions.
First Trading Steps
Choosing Trading Tools
A dependable computer with dual monitors helps. Consider:
| Component | Recommended Options | Key Features |
|---|---|---|
| Brokerage Platform | Interactive Brokers, TD Ameritrade | Advanced features, competitive fees |
| Charting Software | TradingView | Intuitive interface, detailed analysis |
| Scanner/Screener | Trader Workstation, ZenBot | Real-time insights |
| Trading Journal | TraderSync | Performance tracking |
"Using the right day trading software and tools is critical... beginner traders need every advantage possible." – Ross Cameron, Warrior Trading
Charles Schwab stands out for its user-friendly interface and educational resources.
Practice Trading
Demo accounts let you test strategies risk-free:
To fine-tune strategies before going live, consider LuxAlgo’s AI Backtesting.
Creating Trade Rules
Formalize your approach with clear rules to remove emotion and promote consistency:
| Component | Description | Implementation |
|---|---|---|
| Entry Rules | Conditions for opening trades | Technical indicators or price patterns |
| Exit Strategy | Profit targets and stop-loss levels | Based on percentages or key levels |
| Position Sizing | Max risk per trade | 1–2% of total capital |
| Time Management | Define trading hours | Include pre-market analysis |
Next Steps
Core Skills Review
| Skill Category | Key Components | Implementation Tips |
|---|---|---|
| Technical Mastery | Chart analysis, pattern recognition | Study historical charts daily |
| Risk Management | Position sizing, stop-loss placement | Limit risk to 1–2% |
| Emotional Control | Discipline, patience | Follow your trading plan |
| Market Analysis | Trend identification, price action | Use simulators first |


