

Learn how to identify and trade divergence patterns in technical analysis, enhancing your trading strategy and market predictions.
Divergence is a trading concept where price movements and technical indicators do not align, signalling potential market reversals or trend continuations. Tools such as the LuxAlgo Oscillator Matrix toolkit automatically highlight these discrepancies on TradingView, helping traders react more quickly.
- Regular – Indicates possible trend reversals.
- Bullish: Price makes lower lows, indicator shows higher lows.
- Bearish: Price makes higher highs, indicator shows lower highs.
- Hidden – Confirms trend continuation.
- Bullish: Price makes higher lows, indicator shows lower lows.
- Bearish: Price makes lower highs, indicator shows higher highs.
- Extended – Stronger reversal signals that form over multiple price swings.
- RSI: Identifies overbought / oversold conditions. For automated plotting, see the RSI script in the LuxAlgo Library.
- MACD: Tracks trends using moving averages. Try the MACD Library script for extra filters.
- Stochastic Oscillator: Best for range-bound markets.
- Volume analysis confirms signal reliability. The Volume Profile indicator helps visualise where participation is strongest.
- Fibonacci retracement levels pinpoint trade zones.
- Trendline analysis enhances accuracy.
- AI Backtesting Assistant stress-tests divergence ideas across decades of data.
- Use stop-loss orders (e.g., 2 – 3 ATR values).
- Risk only 1 – 2 % of capital per trade.
- Set automated alerts so important divergence signals are never missed.
Divergence trading works across time-frames and market conditions when combined with confirmations such as price action, volume, and additional indicators.
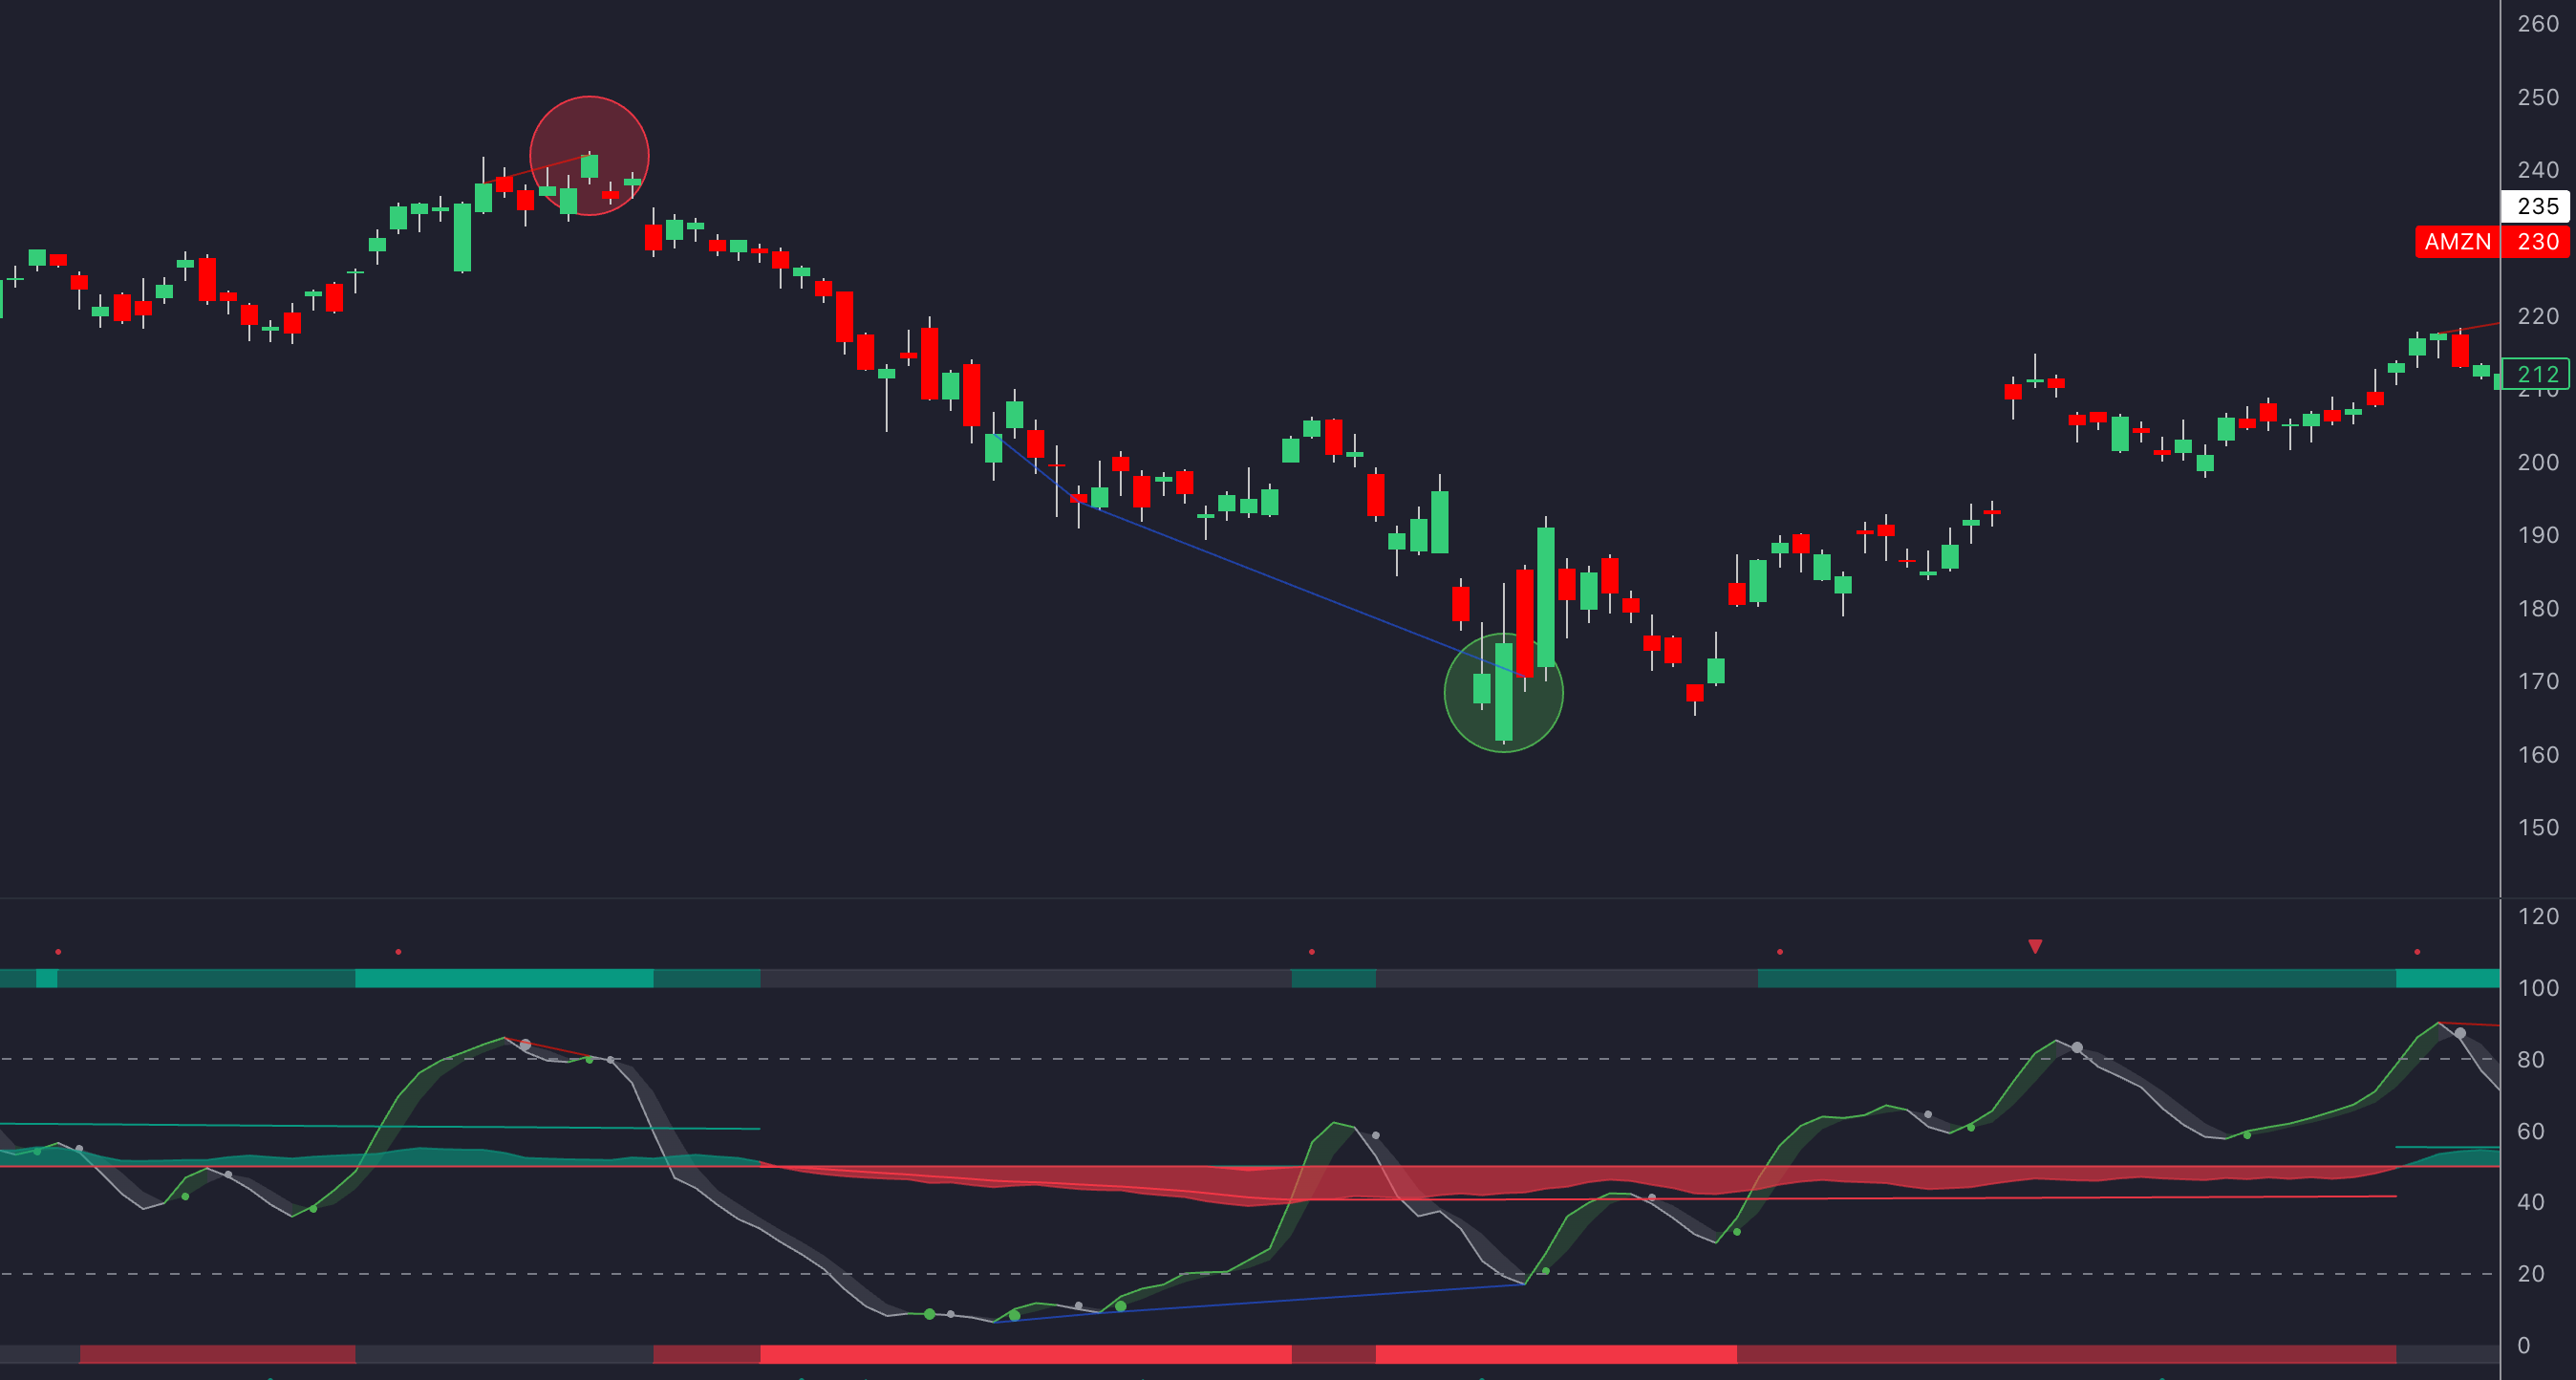
Divergences within the LuxAlgo Oscillator Matrix - Overview
Main Types of Divergence
Divergence patterns help traders spot potential trend reversals or continuations by analysing price movements and technical indicators.
Regular Divergence – Spotting Reversal Opportunities
Regular divergence is a key signal for potential reversals. It occurs when price movement conflicts with the momentum shown by technical tools.
| Type | Price Action | Indicator Movement | Signal |
|---|---|---|---|
| Bullish Regular | Lower lows | Higher lows | Possible upward reversal |
| Bearish Regular | Higher highs | Lower highs | Possible downward reversal |
For instance, in September 2022 the EUR/USD pair showed bearish regular divergence on daily charts: price hit higher highs while the RSI printed lower highs. The pair then declined 3.2 % in two weeks.
Hidden Divergence – Supporting Trend Continuations
Hidden divergence confirms the strength of an existing trend. It highlights opportunities within that trend, favouring continuation.
“Hidden divergence is accurate in confirming trend continuations approximately 75 – 80 % of the time in strong trending markets.” [3]
| Type | Price Action | Indicator Movement | Signal |
|---|---|---|---|
| Bullish Hidden | Higher lows (up-trend) | Lower lows | Trend continuation upward |
| Bearish Hidden | Lower highs (down-trend) | Higher highs | Trend continuation downward |
Extended Divergence – A Stronger Reversal Signal
Extended divergence develops over several swings and therefore often points to more pronounced reversals. Traders who work with market-structure ideas will recognise that extended patterns frequently precede market-structure shifts.
- Builds across multiple swings, not one leg.
- Needs extra confirmation before acting.
- Common on higher time-frames, hinting at bigger moves.
Divergence Detection Methods
Spotting divergence patterns involves analysing technical indicators to uncover conflict between price and momentum. LuxAlgo’s built-in divergence detector and its custom settings streamline the process.
RSI Divergence Patterns
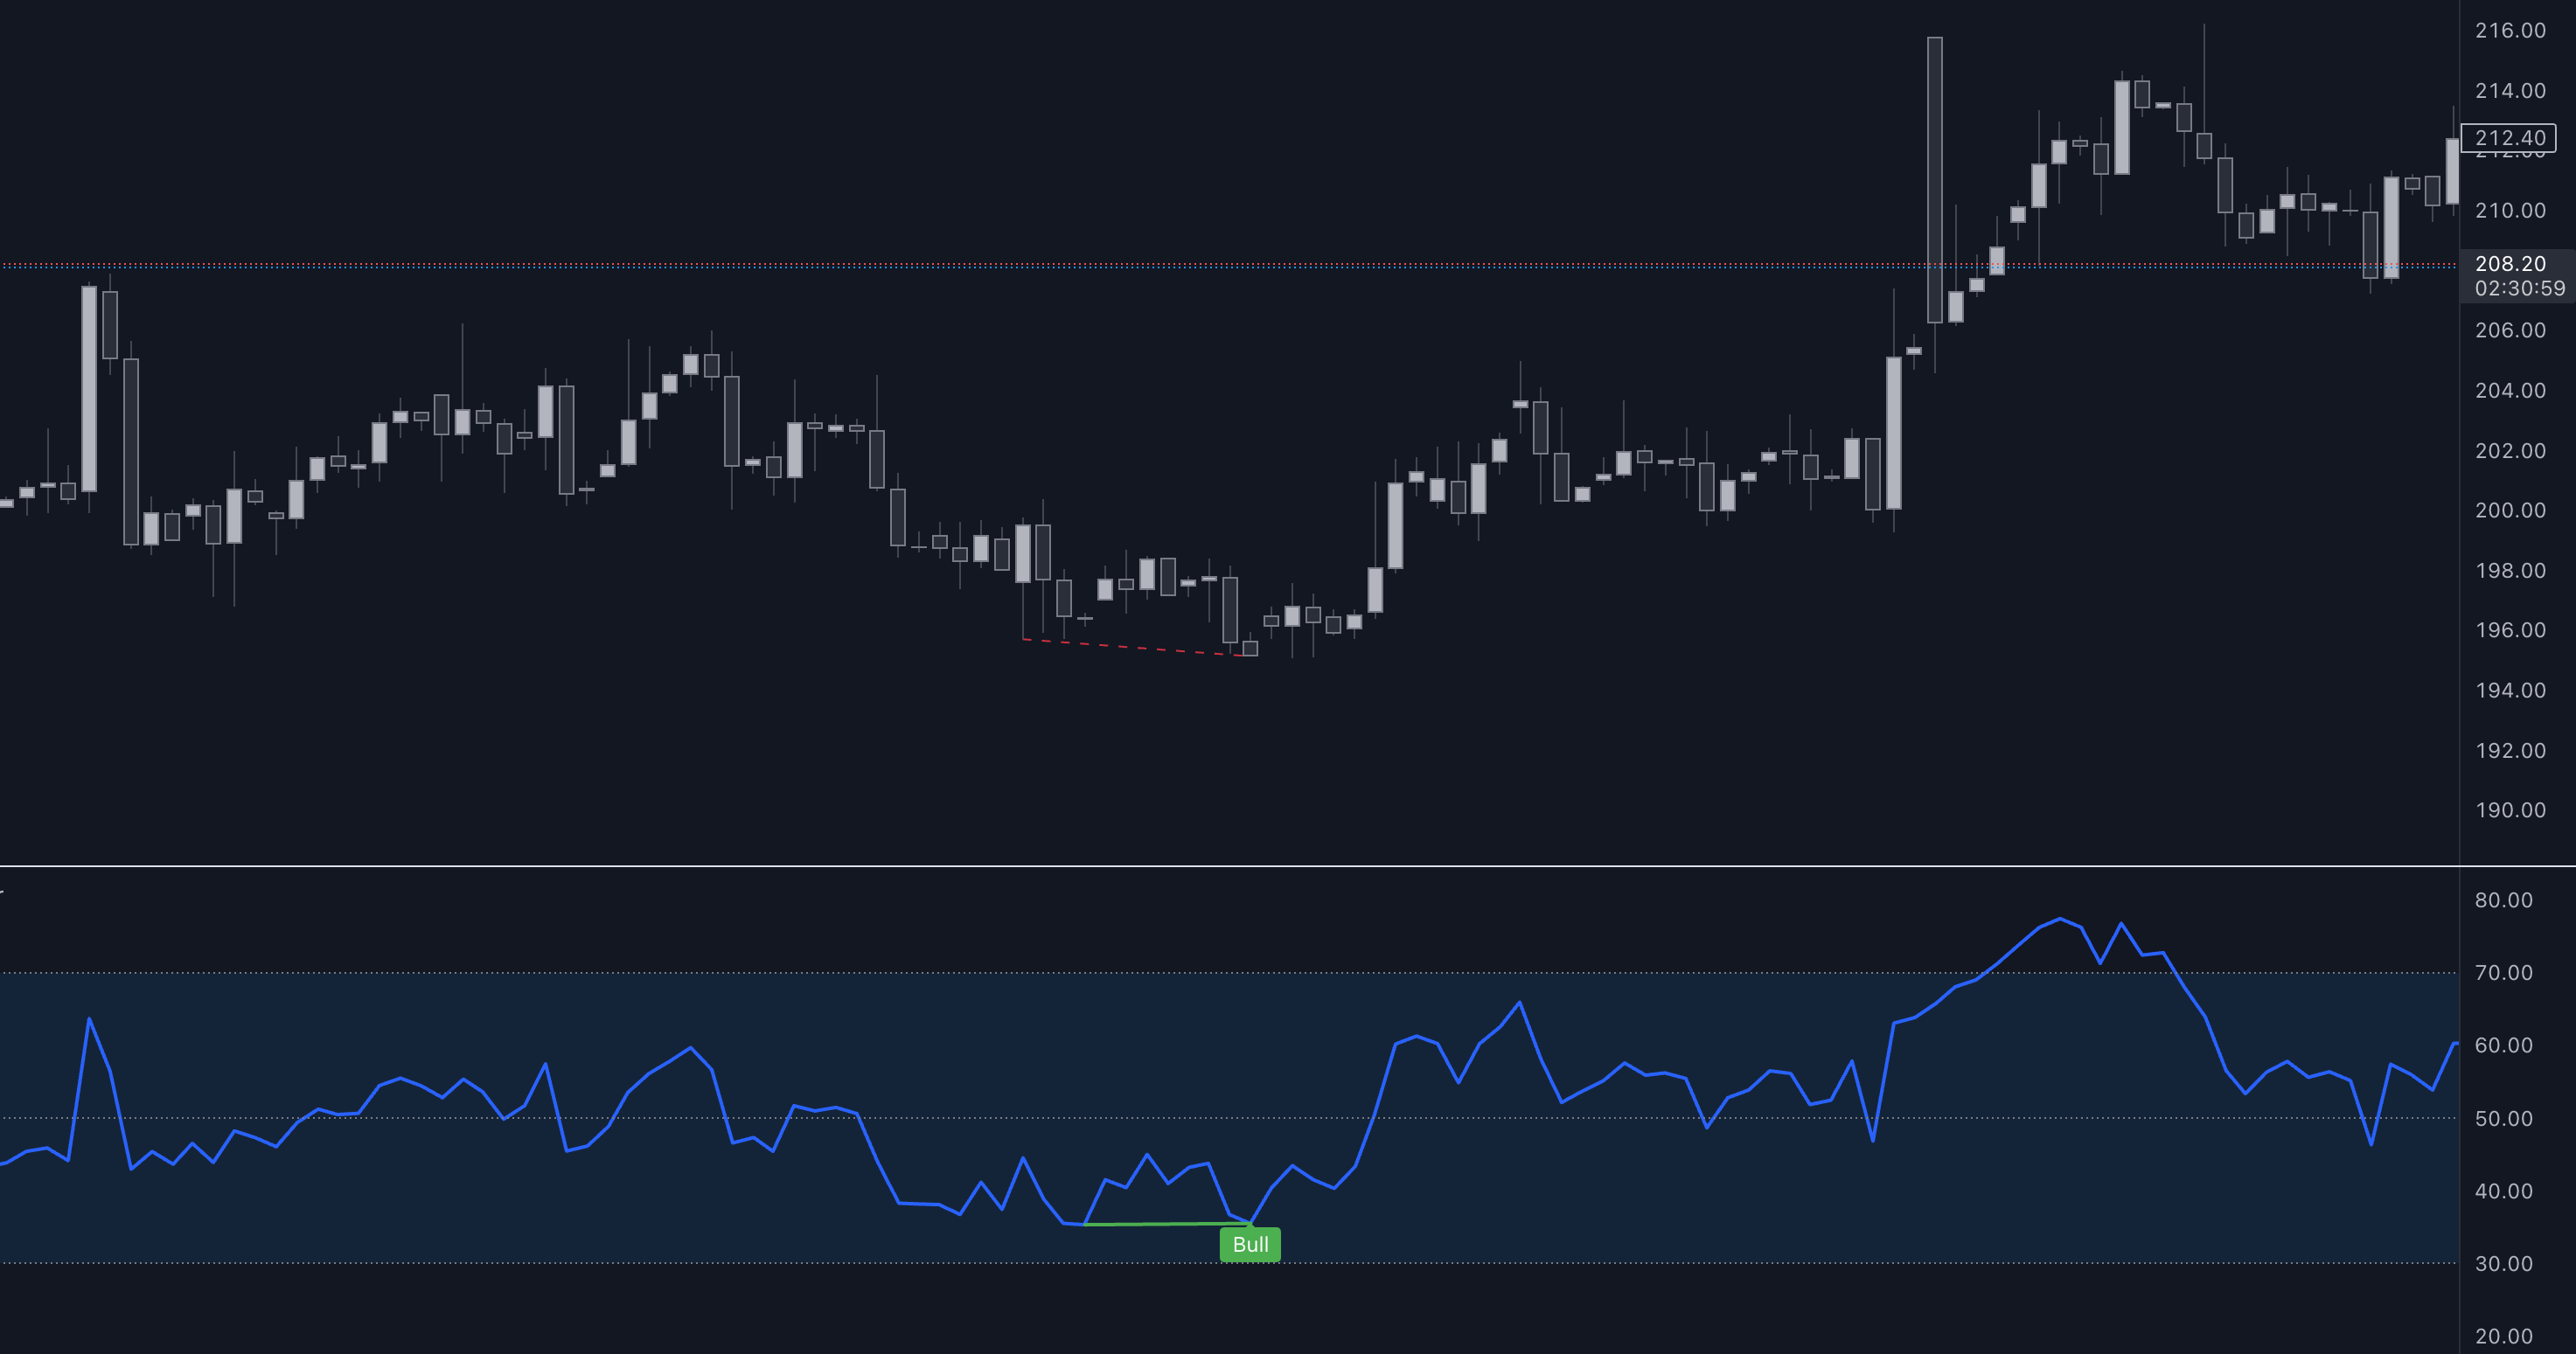
Set the RSI to 14 periods and look for mismatches between price and momentum, especially around the 70 / 30 zones.
- Bullish divergence – price prints lower lows, RSI shows higher lows.
- Bearish divergence – price prints higher highs, RSI shows lower highs.
MACD Divergence Signals
The MACD histogram is another effective way to detect divergence. If you prefer automated detection, explore the Oscillator Matrix.
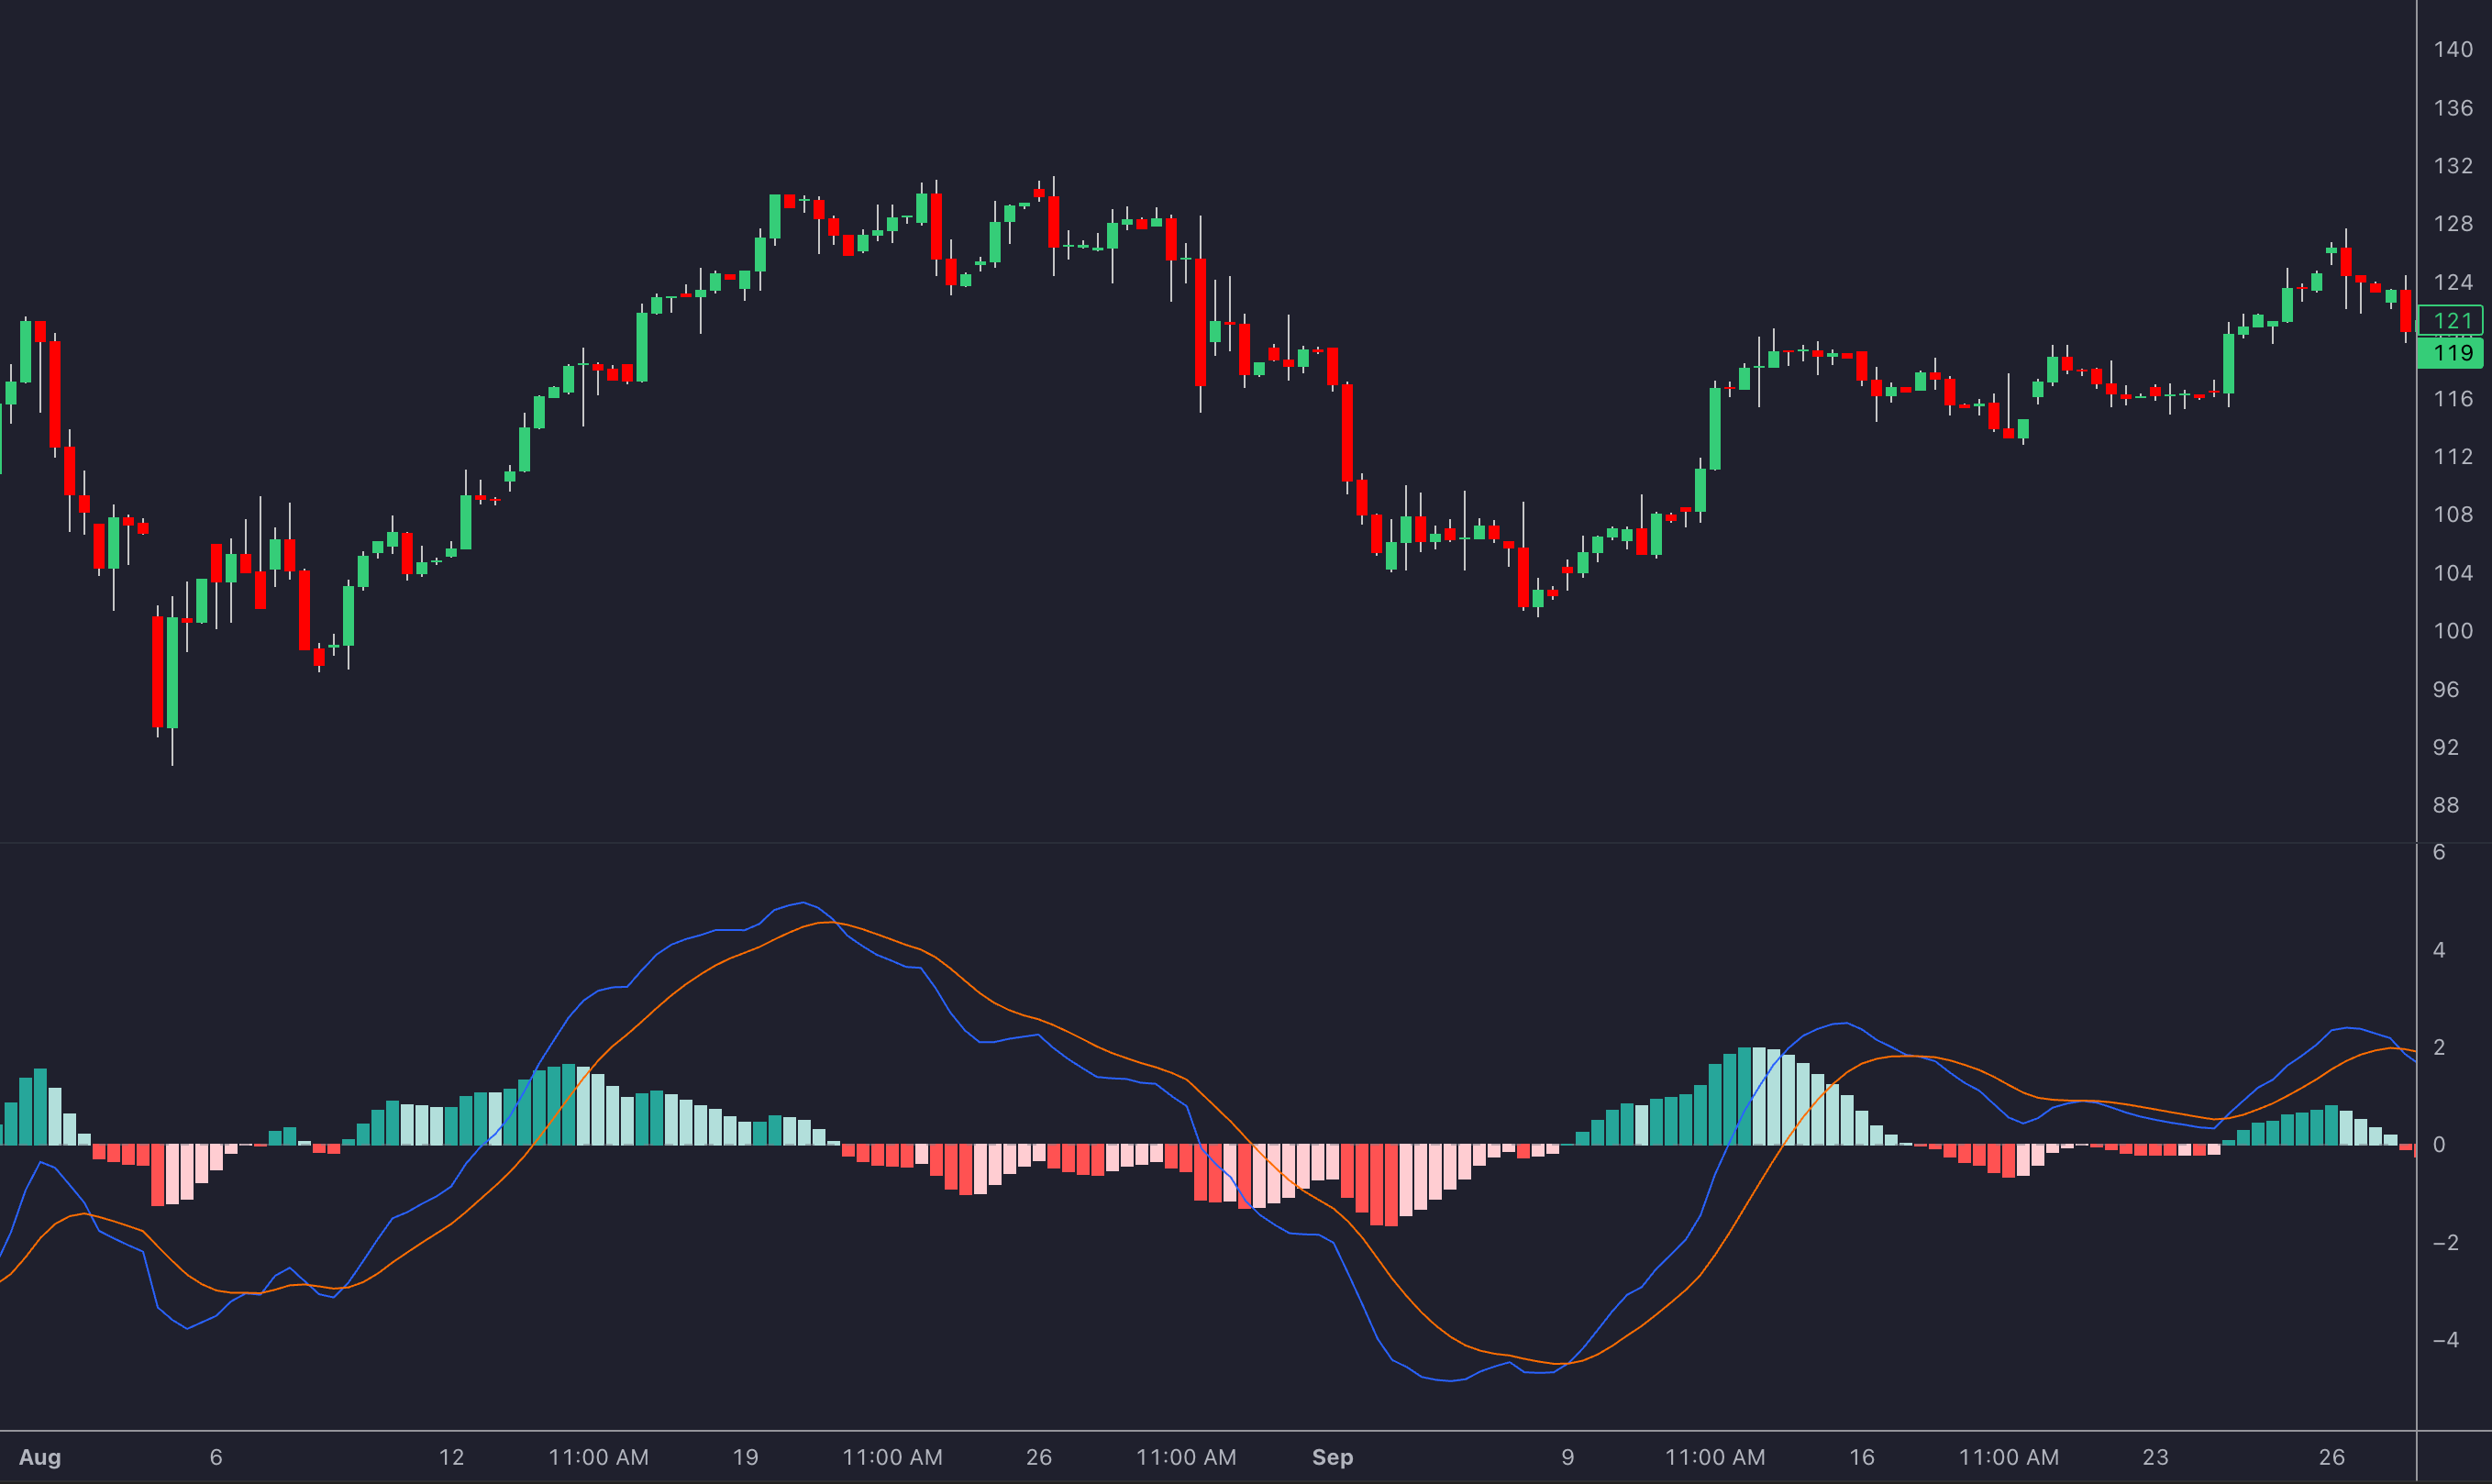
| Divergence Type | Price Action | MACD Signal | Implication |
|---|---|---|---|
| Bullish Regular | Lower lows | Higher lows (histogram) | Upward reversal |
| Bearish Regular | Higher highs | Lower highs (histogram) | Downward reversal |
| Bullish Hidden | Higher lows | Lower lows (histogram) | Up-trend continuation |
| Bearish Hidden | Lower highs | Higher highs (histogram) | Down-trend continuation |
Supporting Tools for Divergence Trading
Volume patterns, Fibonacci levels, and trendline analysis sharpen divergence signals.
Volume Analysis with Divergence
When price and indicators diverge, matching volume patterns provide vital confirmation (68 % boost in accuracy)[1][4].
| Volume Pattern | Signal Confirmation |
|---|---|
| Rising with price lows | Bullish reversal |
| Falling with price highs | Bearish reversal |
| Stable during pull-backs | Trend continuation |
Fibonacci Levels and Divergence
Pairing Fibonacci retracements with divergence increases precision. The 61.8 % level combined with strong divergence produced 64 % winning trades in Bulkowski’s study[2][5].
- 38.2 % – initial reaction zone.
- 50.0 % – mid-point.
- 61.8 % – golden ratio.
Trendline Analysis for Divergence
Divergence signals confirmed by trendline breaks succeed 72 % of the time (versus 53 % without)[3][6].
- Connect recent highs / lows.
- Combine with volume and price action for entry triggers.
Managing Risks in Divergence Trading
Using multi-time-frame confirmation can improve results by 68 %[1]. For deeper analysis, run ideas through the Backtesting Assistant to see performance across thousands of scenarios.
Common Divergence Trading Mistakes
Avoid relying on one signal while ignoring other factors. Combining divergence with key levels and trend context reduces false entries[7].
| Mistake | Consequences | How to Avoid |
|---|---|---|
| Using one indicator | More false signals | Layer indicators |
| Ignoring time-frames | Poor timing | Check multiple charts |
| Entering too early | Higher losses | Wait for price confirmation |
| Oversized positions | High risk | Follow position sizing rules |
Risk Control Methods
Risk only 1 – 2 % per trade[6]. Placing stops 2 – 3 ATR away cushions normal volatility and works well in tandem with the Fibonacci Trailing Stop.
Proven Divergence Trading Rules
Wait for price confirmation before entry, and begin on daily charts before drilling down[2].
Summary – Key Points about Divergence
Combining divergence with supporting tools increases reliability. Confirm with price action, Fibonacci levels and trendlines, and always apply disciplined risk management[5].
FAQs
What is an example of a hidden divergence?
Hidden divergence supports trend continuation:
- Up-trend – price makes higher lows, RSI makes lower lows.
- Down-trend – price makes lower highs, MACD peaks rise.
Always confirm the prevailing trend and focus on daily or weekly charts for higher accuracy.
References
- Oscillator Matrix Toolkit – LuxAlgo Docs
- Reversal Signals – LuxAlgo Docs
- Fibonacci Concepts – LuxAlgo Docs
- Trend Lines – LuxAlgo Library
- Fibonacci Trailing Stop – LuxAlgo Library
- AI Backtesting Assistant – LuxAlgo
- Backtesting Assistant Docs – LuxAlgo
- Market-Structure Shifts – LuxAlgo Docs
- Real-Time Divergences – LuxAlgo Docs
- Oscillator Matrix Introduction – LuxAlgo Docs
- RSI Divergence – LuxAlgo Library
- MACD Enhanced – LuxAlgo Library
- Volume Profile – LuxAlgo Library
- Oscillator Matrix Settings – LuxAlgo Docs
- Alerts – LuxAlgo Docs
- RSI – Investopedia
- MACD – Wikipedia
- Stochastic Oscillator – Investopedia
- ATR – Investopedia
- Fibonacci Retracement – Wikipedia
- Timothy Sykes – RSI Divergence
- XS Blog – Divergence Cheat Sheet
- Orbex – Guide to Divergence
- Investopedia Q&A – Technical Analysis
- Ingot Brokers – Divergence
- Quantified Strategies – Divergence
- QuantInsti Blog – Divergence Trading
- Video – Divergence Trading Explained


