Learn how automated tools can help traders identify price-momentum divergences, enhancing accuracy and efficiency in spotting potential market reversals.
Price–momentum divergences can signal potential trend reversals in markets. They occur when price movements and momentum indicators (like RSI or MACD) conflict, highlighting shifts in market strength. Spotting these divergences manually is tedious and prone to errors, which is why LuxAlgo is a game-changer for many TradingView users. LuxAlgo provides automated divergence detection tools that scan multiple timeframes and assets, removing guesswork and improving efficiency.
Key Takeaways:
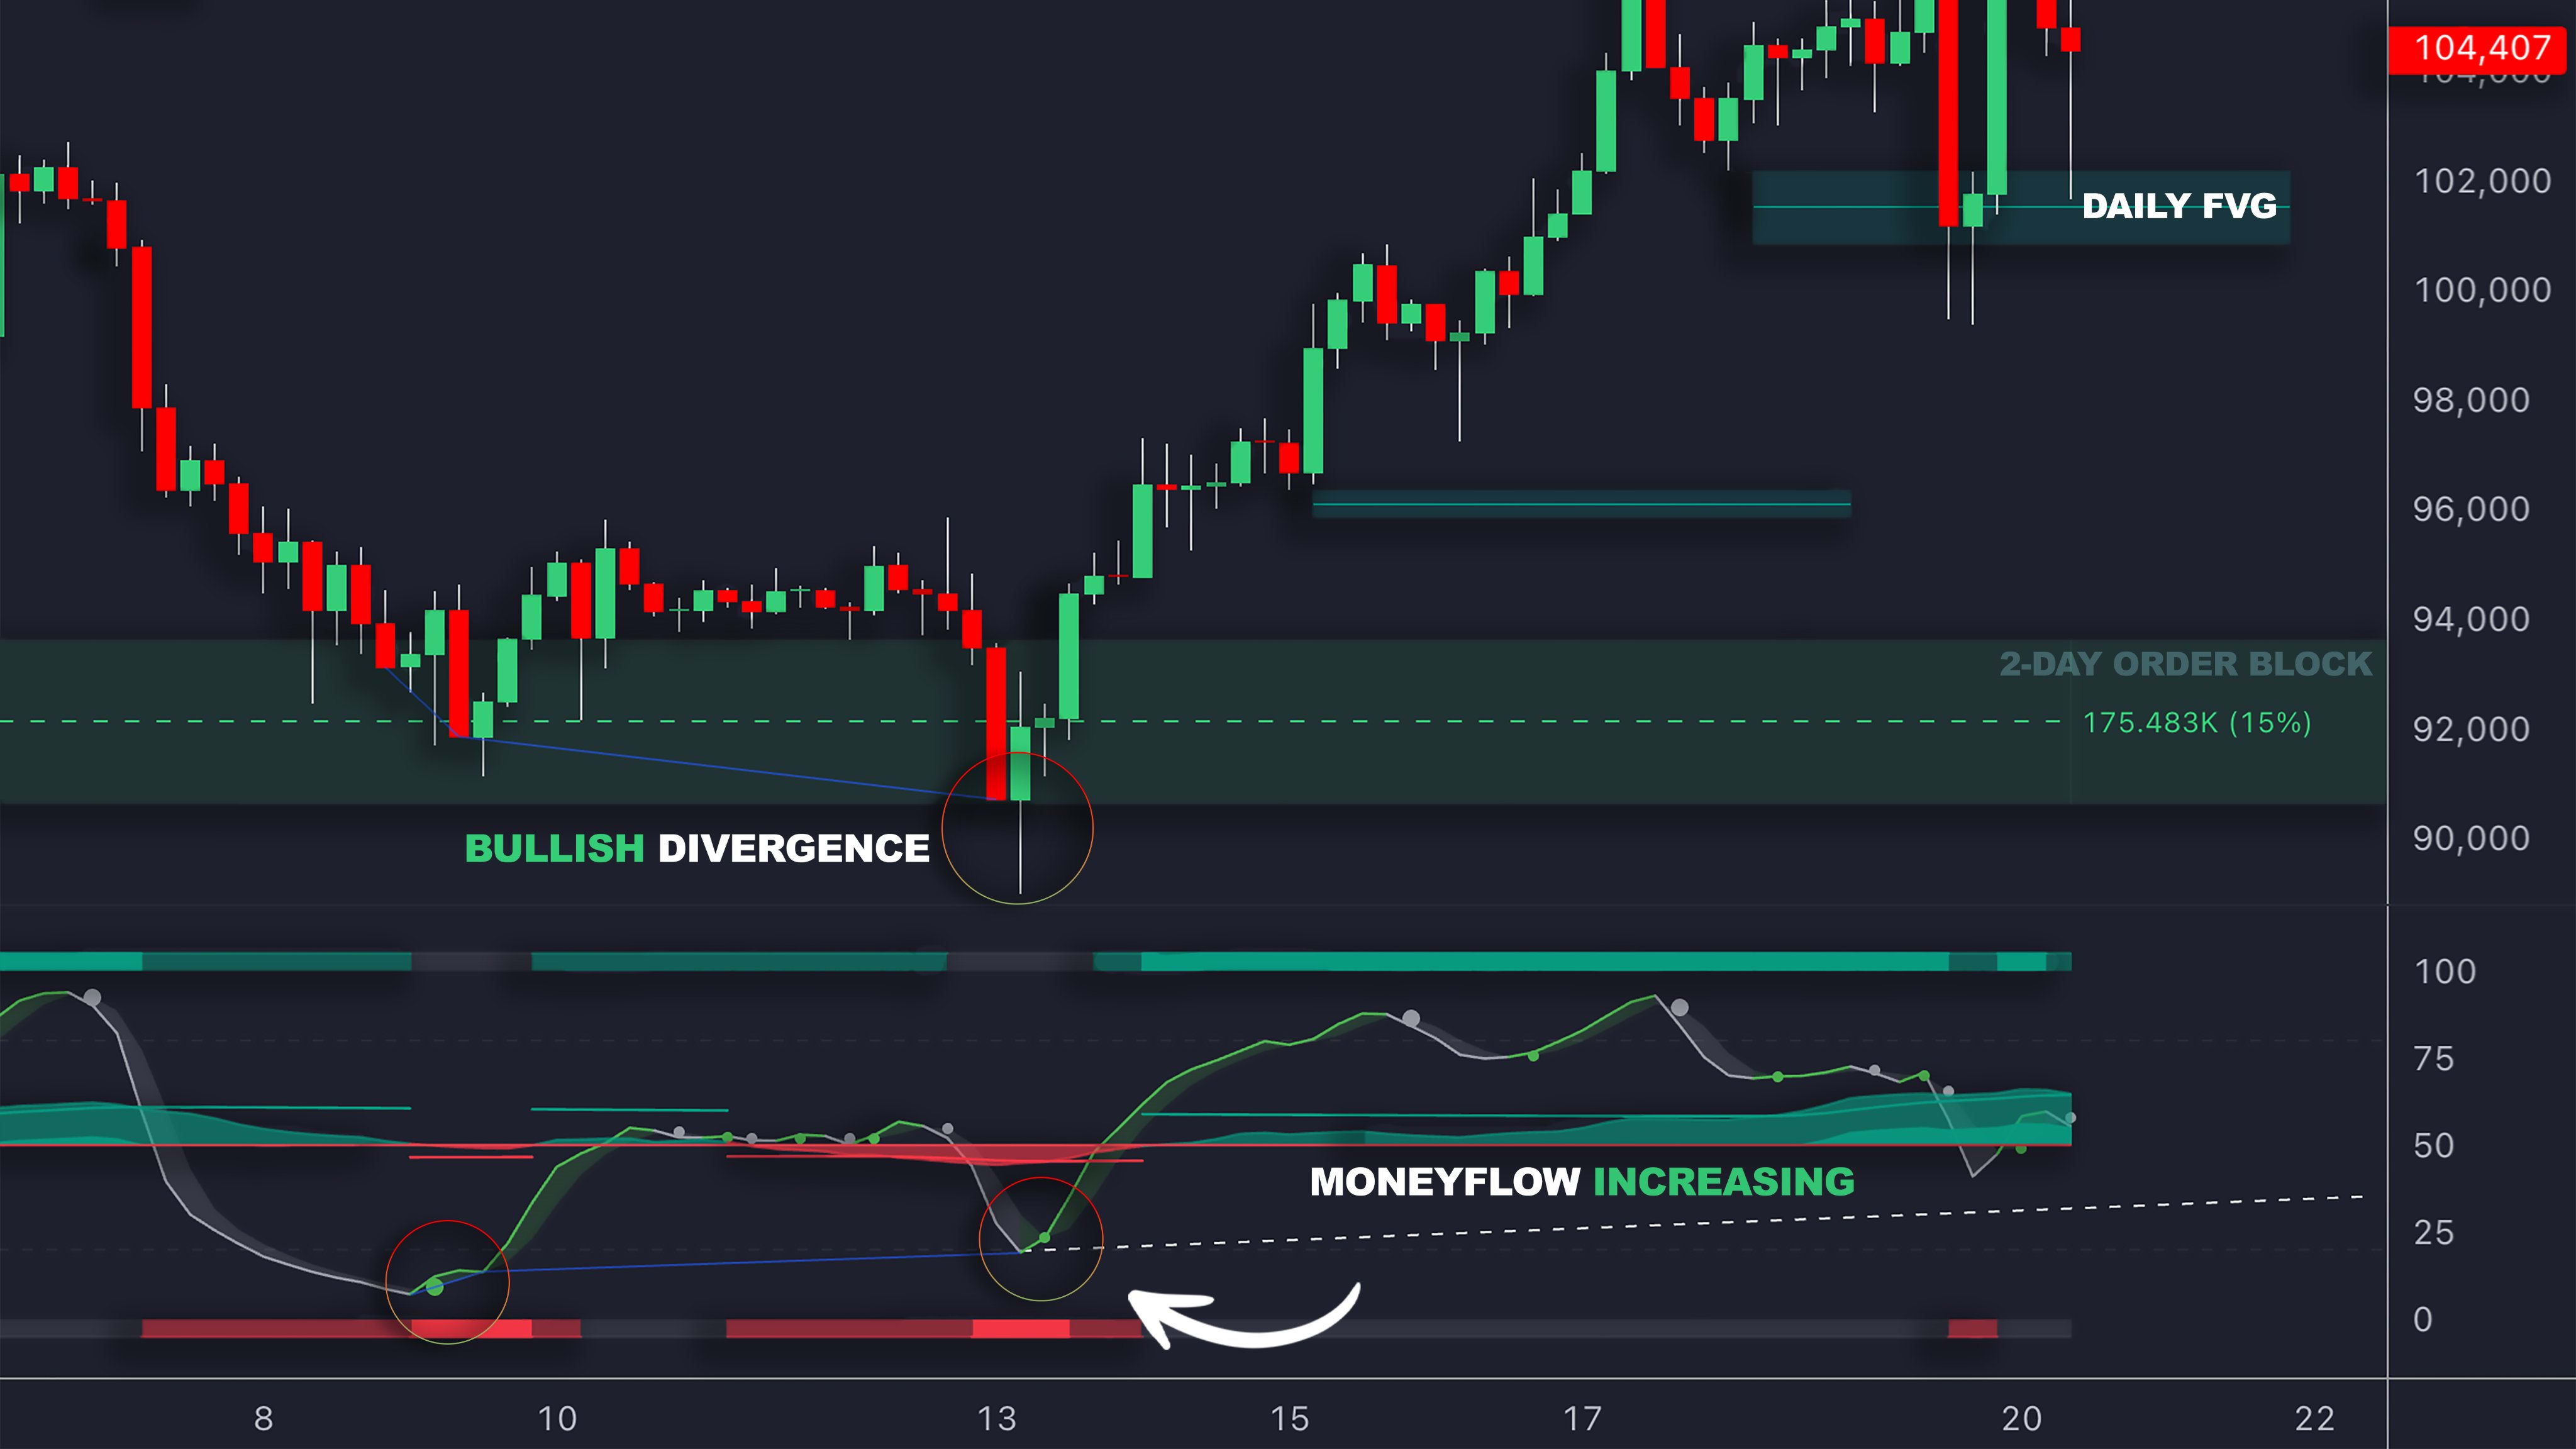
- Bullish Divergence: Prices make lower lows, but momentum forms higher lows, hinting at a possible upward reversal.
- Bearish Divergence: Prices hit higher highs, but momentum shows lower highs, signaling a potential downturn.
- Hidden Divergences: Indicate trend continuation during pullbacks or corrections.
Why Automation Helps:
- Consistency: Eliminates subjective interpretation.
- Efficiency: Scans multiple assets and timeframes quickly.
- Accuracy: Reduces false signals by applying strict criteria.
LuxAlgo Features:

- Oscillator Matrix (OSC): Automatically detects divergences using RSI, MACD, and more.
- Signals & Overlays (S&O): Visual markers for quick identification.
- TradingView Integration: Real-time alerts and backtesting for strategy refinement.
Automated divergence detection simplifies trading by identifying momentum shifts faster and more reliably, allowing traders to focus on strategy and risk management.
Divergence Master Class (Video)
This master class walks through how traders interpret bullish, bearish, and hidden divergences in real chart conditions, and why divergence is best treated as a momentum warning rather than an automatic reversal trigger. It also highlights practical confirmation ideas (like structure, support/resistance, and trend context) so you can better separate high-quality setups from noisy signals—especially when divergences appear frequently on lower timeframes.
Types of Divergences and What They Mean
Knowing the different types of divergences can help traders better interpret market signals. Each type provides clues about potential price movements and trend shifts, making it essential to understand their unique characteristics.
Bullish and Bearish Divergences
A bullish divergence occurs when prices hit lower lows, but a momentum indicator (like RSI or MACD) forms higher lows [1]. This suggests that selling pressure is weakening, even as prices fall, hinting that buyers might soon step in and push prices higher.
On the flip side, a bearish divergence happens when prices reach higher highs while the momentum indicator shows lower highs [1]. This signals that upward momentum is losing steam, even though prices are climbing, which could foreshadow a downturn. Now, let’s delve into hidden divergences, which shed light on trend persistence during retracements.
Hidden Divergences
Hidden divergences take things a step further by confirming trend strength. A hidden bullish divergence is when prices make higher lows, but the momentum indicator creates lower lows. This often signals that an uptrend remains intact, even during pullbacks. Similarly, a hidden bearish divergence is seen when prices form lower highs while the momentum indicator shows higher highs, pointing to a sustained downtrend.
These patterns are particularly helpful for traders looking to add to their positions during minor corrections, as they differentiate between temporary pullbacks and actual trend reversals.
Avoiding False Signals
While divergences can be powerful tools, they’re not foolproof. False signals are common, especially in sideways or choppy markets, so traders need to confirm divergence patterns with additional analysis.
For instance, bullish divergences gain credibility if accompanied by a breakout above resistance or the formation of higher highs. Likewise, bearish divergences are more reliable when paired with a drop below support or new lower lows. Analyzing multiple timeframes can also improve accuracy - divergences visible on both daily and weekly charts are often more reliable than those seen on shorter timeframes.
To increase the odds of success, combine divergence analysis with other tools like support and resistance levels, trend lines, and candlestick patterns. This multi-layered approach can help traders identify higher-probability setups and avoid being misled by false signals.
Momentum Indicators for Finding Divergences
The right momentum indicator can be a game-changer when you're on the lookout for divergences. These tools cut through the noise of price action, helping you spot shifts that could signal potential reversals. Here’s a closer look at key indicators and how to use them effectively.
Main Indicators: RSI, MACD, and Others
The RSI (Relative Strength Index) is a go-to tool for spotting divergences. It measures price changes on a scale from 0 to 100, making it easy to identify shifts in momentum. For example, when RSI forms higher lows while the price makes lower lows, it suggests that selling pressure is weakening - a textbook bullish divergence. A 14-period RSI is a common choice, but shorter settings like 9 or 11 can provide quicker, more sensitive readings.
The MACD (Moving Average Convergence Divergence) is another popular choice, thanks to its dual-line system. It excels at identifying momentum shifts. Crossovers between the MACD line and its signal line, combined with changes in the histogram, often reveal fading momentum. For instance, if the price hits new highs but the MACD histogram shows lower peaks, it could be an early signal of a potential reversal.
The Stochastic Oscillator compares the closing price to the high-low range over a set period, typically 14 days. It’s particularly useful when it moves into overbought (above 80) or oversold (below 20) zones while the price action tells a different story. These contradictions often highlight divergence opportunities.
Other tools like the CCI (Commodity Channel Index) and Williams %R can also help spot cyclical turning points or early momentum shifts. However, they require a bit more experience to interpret accurately.
The beauty of momentum indicators lies in their ability to strip away market noise, making it easier to focus on the momentum patterns that often drive meaningful price movements [2].
Picking the Right Indicator for Your Strategy
All momentum indicators aim to reveal divergence signals, but the best choice depends on your trading style, the assets you trade, and your preferred timeframes.
- Day traders often lean toward faster indicators, like a 9-period RSI or a MACD with settings of 5,13,9. These are great for catching quick momentum shifts during active sessions but demand careful filtering to avoid false signals.
- Swing traders typically stick with standard settings, such as a 14-period RSI, a MACD with 12,26,9 settings, or a 14-period Stochastic Oscillator. These settings strike a balance between sensitivity and reliability over multi-day trades, filtering out the noise that can mislead shorter-term signals.
- Position traders, who focus on weekly or monthly charts, tend to extend indicator periods to 21 or even 30. For example, a 21-period RSI on a weekly chart can highlight major trend changes well before they become evident in the price itself.
Your choice of indicator should also align with market conditions. In trending markets, MACD tends to perform better because of its trend-following nature. On the other hand, range-bound markets are where RSI and Stochastic Oscillators shine, as they clearly pinpoint overbought and oversold levels. For highly volatile assets like cryptocurrencies, longer indicator periods can help smooth out wild price swings, while standard settings often work just fine for more stable markets like forex.
Testing your chosen indicator across various market conditions is crucial. This practice not only helps you understand its strengths and weaknesses but also allows you to fine-tune settings - like period lengths and sensitivity - to better suit your trading style and the markets you focus on [3].
Keep in mind that divergence signals highlight shifts in momentum, not guaranteed reversals [2]. When momentum indicators and price action don’t align, it’s often a sign that the current trend is losing strength. This could lead to consolidation, pullbacks, or even full reversals. Understanding this helps you set realistic expectations and build risk management strategies around these signals.
Using LuxAlgo for Automated Divergence Detection
Spotting divergences manually can be a tedious and error-prone task, but LuxAlgo simplifies this process by automating it for both accuracy and speed. These tools identify divergence signals as they emerge, giving traders an edge in fast-moving markets. Let’s take a closer look at how LuxAlgo’s TradingView toolkits enhance divergence detection.
LuxAlgo Tools for Divergence Detection
One of LuxAlgo’s standout solutions is the Oscillator Matrix (OSC) toolkit, designed for real-time divergence detection. This tool scans multiple momentum indicators simultaneously - including RSI, MACD, and Stochastic - automatically identifying divergence patterns without the need for manual monitoring.
The OSC toolkit leverages algorithms to sift through market noise and isolate genuine momentum shifts, significantly reducing the risk of false signals that often challenge manual analysis.
The Signals & Overlays (S&O) toolkit works in tandem with momentum analysis, offering visual cues that highlight when price action conflicts with underlying momentum. These chart overlays make it easier to spot divergence opportunities at a glance.
The Price Action Concepts (PAC) toolkit adds another layer by detecting changes in market structure often linked to divergence signals. By combining this with momentum analysis, traders gain a multi-dimensional approach to identifying potential reversals.
Each toolkit also includes advanced screeners that can scan hundreds of assets for divergence setups. Instead of manually reviewing multiple charts, the screeners filter and present the most relevant opportunities, saving valuable time.
TradingView Integration

LuxAlgo takes efficiency a step further by integrating seamlessly with TradingView, enhancing the automated detection process. Once the OSC toolkit is added to your TradingView workspace, divergence signals appear directly on your charts as visual markers, removing the guesswork from interpreting momentum and price movements.
The integration also includes alert functionality. You can set up alerts to be notified instantly - via TradingView notifications, email, or mobile push - when divergence patterns form.
Backtesting tools are another valuable feature. The OSC Backtester allows traders to evaluate how divergence signals would have performed in the past across different timeframes and market conditions. This helps refine strategies before committing real capital.
The Alert Creator adds even more customization, letting you combine divergence signals with other technical conditions. For instance, you could set an alert to trigger only when a bullish divergence aligns with a key support level, narrowing down to higher-probability setups.
Benefits of Automated Divergence Detection
LuxAlgo’s OSC, S&O, and PAC toolkits provide a range of advantages for traders looking to streamline and enhance their divergence analysis:
- Reduced decision fatigue: Let the system handle divergence detection, freeing up your mental bandwidth for other aspects of trading.
- Improved accuracy: Algorithms process multiple data points without emotional bias, ensuring consistent results across all market conditions.
- Streamlined workflows: Focus on trade execution and risk management while the tools monitor momentum indicators across your watchlist.
- Speed advantage: Automated detection identifies divergence patterns within seconds, giving you a head start before others notice the trend.
- Consistency: By removing subjective interpretation, LuxAlgo creates a systematic approach to divergence trading that can be backtested and fine-tuned over time.
With these features, LuxAlgo transforms how traders detect and act on divergence signals, offering a more efficient and reliable way to navigate the markets.
How to Use LuxAlgo for Divergence Detection
Ready to dive into divergence signals with LuxAlgo? Let’s break down how to set up, interpret, and fine-tune your trading strategy using LuxAlgo’s TradingView toolkits. It all starts with configuring automated divergence detection settings.
Setting Up LuxAlgo's Oscillator Matrix
The Oscillator Matrix (OSC) is a go-to option for spotting divergences automatically. Once you’ve added it to TradingView through your LuxAlgo subscription, it appears as a panel below your chart.
Start by selecting your momentum indicators. The OSC toolkit supports RSI, MACD, Stochastic, and more, letting you use multiple oscillators simultaneously. Adjust these settings based on your trading style - day traders often prefer shorter periods, while swing traders lean toward longer ones.
Fine-tune sensitivity to match market volatility. Higher sensitivity picks up on smaller divergences but may generate more false signals. Lower sensitivity filters out noise but might miss subtle opportunities.
Customize settings for different assets. For example, cryptocurrencies often require a longer lookback period (20-25 bars) due to their rapid price swings, while stocks typically perform well with the default 14-period setting.
Choose timeframes based on your trading approach. If you want fewer but more reliable signals, stick to higher timeframes like 4-hour or daily charts. For frequent alerts, lower timeframes like 15-minute charts are ideal - just keep your trading goals in mind.
Once everything is set up, you’re ready to interpret the divergence signals that appear on your chart.
Reading Divergence Signals
Visual markers make divergences easy to spot. The OSC highlights divergences by connecting price peaks or troughs with oscillator peaks or troughs. Green lines indicate bullish divergences - when the oscillator forms higher lows while the price makes lower lows. Red lines signal bearish divergences - when momentum shows lower highs while price continues to rise.
Signal strength ratings help prioritize trades. The OSC rates divergences based on factors like the angle of divergence and the number of confirming oscillators. Stronger signals occur when multiple indicators (like RSI, MACD, and Stochastic) align, offering more reliable reversal opportunities compared to single-indicator setups.
Set alerts for timely updates. Use TradingView to create alerts for bullish and bearish divergences. Customize alert tones or enable mobile push notifications for assets you’re closely watching. For longer-term trades, email alerts can be a good option.
Context is key when analyzing signals. A bullish divergence near a major support level is more meaningful than one in the middle of a downtrend. Similarly, bearish divergences near resistance or after a prolonged rally often yield stronger results. The Signals & Overlays toolkit can help you identify these critical levels automatically.
Don’t overlook hidden divergences. These indicate trend continuation rather than reversal. For example, a hidden bullish divergence (higher lows on the oscillator and lower lows on price during an uptrend) suggests the trend will keep climbing. Hidden bearish divergences work the same way in a downtrend.
Once you’ve got a handle on reading signals, it’s time to test and refine your strategy.
Testing and Improving Your Strategies
Backtesting is essential for validating your approach. Use the OSC Backtester to analyze how divergence signals perform across different market conditions and timeframes. Start with 12 months of historical data for your preferred assets to get a solid baseline.
Optimize your strategy by testing variables. Experiment with different oscillator combinations, sensitivity levels, and confirmation requirements. For instance, compare results from using RSI alone versus pairing RSI with MACD. Document which setups yield the best win rates and returns for your trading style.
Use performance metrics to guide adjustments. Pay attention to metrics like win rate, average profit per trade, maximum drawdown, and profit factor. A strategy with a 60% win rate and a 2:1 reward-to-risk ratio can outperform one with an 80% win rate but poor risk management. The backtester provides these metrics to make comparisons easy.
Forward testing bridges the gap to live trading. After backtesting, test your strategy in real-time with a demo account or small position sizes for 30-60 days. This helps you understand how it performs under actual market conditions, including slippage and execution delays.
Regular reviews keep your strategy effective. Markets evolve, and strategies that work in trending conditions might falter during sideways movements. Review your performance monthly, tweaking settings if win rates drop or patterns emerge in losing trades.
Take advantage of the AI Backtesting Assistant. For Ultimate subscribers, this tool can automatically test thousands of parameter combinations and recommend the best settings based on your risk tolerance and goals. It can uncover patterns you might miss, like which oscillator combos thrive in specific market conditions.
Incorporate risk management for long-term success. Even the most reliable divergence signals can fail. Limit risk by sizing positions carefully and setting stop-loss orders just beyond recent swing highs or lows. Many traders cap their risk at 1-2% per trade to protect their capital.
Key Takeaways for Traders
Automated divergence detection offers traders a smarter, more efficient way to refine their trading strategies. Here’s how it can transform your approach:
Shifting from manual analysis to automated tools turns a once time-intensive process into an efficient system. By combining technology with trading expertise, you can unlock opportunities that are nearly impossible to spot through visual analysis alone.
Why Automated Divergence Detection Matters
Speed and precision in real time: Automated tools provide instant detection, which is crucial during volatile market sessions where divergences can appear and disappear quickly across multiple assets.
Consistency overcomes human error: Unlike manual analysis, automated systems apply the same criteria every time, removing emotional or biased decision-making from the equation.
Multi-timeframe monitoring: Automated tools allow you to track short-term and long-term setups simultaneously, eliminating the need to constantly switch between charts and helping you identify diverse trading opportunities.
Instant alerts for high-probability setups: Real-time notifications ensure you never miss a critical divergence, even if you’re away from your desk or focusing on other tasks.
Trading Best Practices
While automation provides technical advantages, successful trading still depends on sound practices and judgment.
- Blend automation with market insight: LuxAlgo can help flag divergences consistently, but your understanding of market conditions, trends, and news events is essential for filtering out lower-quality signals. Use automated alerts as a starting point and apply your expertise to refine your decisions.
- Prioritize risk management: Even the most accurate signals can fail under unexpected circumstances, like news shocks or extreme volatility. Stick to solid risk management principles - limit risk to 1-2% per trade, use stop-loss orders, and diversify your portfolio to protect against significant losses.
- Regularly review your strategy: Markets change, and strategies that work in trending conditions may falter during sideways or choppy periods. Use backtesting to assess your performance monthly and fine-tune your approach as needed. This ensures your strategy remains effective over time.
- Start small and scale gradually: Begin with smaller positions to get comfortable with automated signals. As your confidence grows and your win rate improves, you can increase your position sizes and expand to other assets. This cautious approach helps you build strong trading habits without exposing yourself to unnecessary risk during the learning phase.
Automated divergence detection enhances your trading by handling the heavy lifting of pattern recognition, allowing you to focus on strategy refinement and risk management. It’s a capability that, when combined with disciplined practices, can significantly elevate your trading.
FAQs
How does LuxAlgo’s automated divergence detection help traders save time and improve accuracy?
LuxAlgo’s automated divergence detection simplifies trading by quickly spotting price–momentum divergences, which often signal potential market reversals. This means traders no longer have to spend hours analyzing charts manually, cutting down on time and helping to avoid emotionally-driven decisions.
The approach supports real-time alerts and consistent signals, enabling traders to act quickly and with greater confidence. By applying clear, repeatable criteria, traders can concentrate on executing their strategies, which can lead to more consistent decision-making over time.
What are bullish, bearish, and hidden divergences, and how do they impact trading strategies?
Bullish divergences show up when the price creates lower lows, but a momentum indicator like RSI or MACD forms higher lows. This can hint at a possible upward reversal. On the flip side, bearish divergences occur when the price hits higher highs, but the indicator shows lower highs, pointing to a potential downward reversal.
Hidden divergences, however, suggest a continuation of the current trend rather than a reversal. A hidden bullish divergence happens when the price makes higher lows, while the indicator forms lower lows, signaling the uptrend may persist. Meanwhile, a hidden bearish divergence appears when the price creates lower highs and the indicator shows higher highs, suggesting the downtrend is likely to keep going.
These patterns offer traders useful clues about market direction, helping them fine-tune their entry and exit points for better trading decisions.
How can traders use LuxAlgo's tools to improve their strategies and manage risk more effectively?
Traders looking to refine their strategies can benefit from LuxAlgo’s TradingView toolkits, which are designed to pinpoint key market signals and trends with precision. Features such as real-time alerts, customizable trade management, and systematic backtesting workflows make it easier to manage risk while making well-informed decisions.
With automated divergence detection and toolkit-based confirmations, traders can identify potential trend reversals earlier, which can lead to more disciplined entries and exits and a more consistent, data-informed approach to trading.
References
LuxAlgo
- Reversal Signals (Oscillator Matrix Docs)
- Adaptive Momentum Oscillator (Library)
- Oscillator Matrix (Library)
- Multi-Timeframe Market Formation (Library)
- Support & Resistance Dynamic (Library)
- Trend Lines (Library)
- Candlestick Structure (Library)
- Price Action Concepts (Library)
- SMT Divergences (Library)
- Triangular Momentum Oscillator: Real-Time Divergences (Library)
- Market Structure (Price Action Concepts Docs)
- Alerts Scripting Update Actions (Blog)
- AI Backtesting Assistant: Complete Breakdown (Blog)
External Resources
- Divergence (Investopedia)
- Trading Divergence and Understanding Momentum (Investopedia)
- Stochastic Oscillator (Investopedia)
- Relative Strength Index (Wikipedia)
- MACD (Wikipedia)
- Commodity Channel Index (Wikipedia)
- Williams %R (Wikipedia)
- Stochastic Divergence (StocksToTrade)
- TradingView (Website)
- Slippage (Investopedia)
- Stop-Loss Order (Investopedia)