

Engulfing patterns are key candlestick signals that indicate market reversals, essential for traders seeking to improve their strategies.
Engulfing patterns are powerful candlestick formations that signal potential market reversals. They occur when a larger candlestick completely engulfs the body of the previous one, indicating a shift in buyer seller momentum. Here's a quick breakdown:
- Bullish Engulfing Pattern: Forms during a downtrend. A large green candle fully covers a smaller red candle, signaling buyers are taking control.
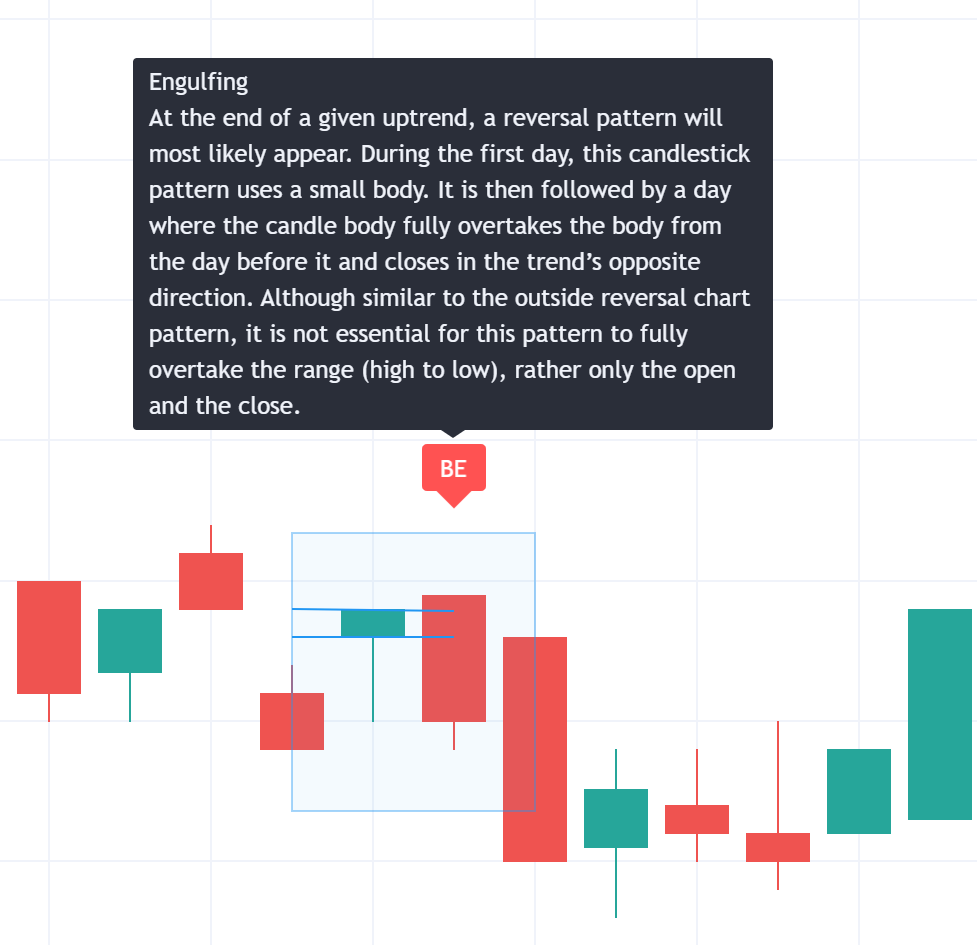
- Bearish Engulfing Pattern: Forms during an uptrend. A large red candle fully covers a smaller green candle, signaling sellers are gaining control.
- Key Features:
- Appears after a clear trend (downtrend for bullish, uptrend for bearish).
- High trading volume strengthens reliability.
- Works best on longer timeframes (daily, weekly).
Quick Tips:
- Confirm signals with the next candlestick.
- Avoid patterns in sideways markets.
- Combine with indicators like RSI or MACD for better accuracy.
Engulfing patterns are most effective near support or resistance levels and can deliver a 60-70% success rate when identified correctly. Let’s dive deeper into how to recognize, trade, and validate these patterns.
Candlestick Engulfing Pattern Tutorial
Types of Engulfing Patterns
This section breaks down bullish and bearish engulfing patterns, focusing on their formation and how they signal potential market reversals.
Bullish Patterns
Bullish engulfing patterns emerge during downtrends and indicate a potential shift to upward momentum. They consist of two candlesticks: a smaller bearish candle followed by a larger bullish candle that fully covers the previous candle's body.
The pattern is more reliable when:
- The second candle opens below the prior low.
- It has little to no upper wick.
- It is accompanied by high trading volume.
For added confidence, look for these patterns after at least four consecutive bearish candlesticks.
Bearish Patterns
Bearish engulfing patterns occur in uptrends and suggest a possible downward reversal. This pattern forms when a larger bearish candle completely engulfs the body of a smaller preceding bullish candle.
| Pattern Characteristic | Bullish Engulfing | Bearish Engulfing |
|---|---|---|
| Market Position | Forms at support after a downtrend | Occurs at resistance in an uptrend |
| First Candle | Small bearish (red/black) | Small bullish (green/white) |
| Second Candle | Large bullish; gaps down at open | Large bearish; gaps up at open |
| Success Rate | 60-70% | 60-70% |
| Volume Indicator | Higher volume validates reversal | Higher volume validates reversal |
"A bearish engulfing pattern typically forms after an extended move up. It's a sign of exhaustion and a signal that a market may be in the early stages of reversing." - Justin Bennett
Bearish patterns are particularly effective when they appear near key resistance levels with strong selling pressure. Both bullish and bearish engulfing patterns show a 60-70% success rate when correctly identified. However, their reliability tends to drop in sideways markets. Using additional technical indicators can help confirm these patterns and improve trading decisions.
Pattern Recognition Guide
Understanding and accurately identifying engulfing patterns is crucial to avoid misleading signals and make better trading decisions. The key rule: the second candle must fully cover the body of the first candle. For these patterns to be most effective, they should appear after a weakening trend or near key support or resistance levels.
| Component | Bullish Engulfing Criteria | Bearish Engulfing Criteria |
|---|---|---|
| Market Context | Forms after a downtrend | Forms after an uptrend with higher highs |
| First Candle | Small bearish body | Small bullish body |
| Second Candle | Large bullish candle that engulfs the first | Large bearish candle that engulfs the first |
| Volume | Higher volume on the engulfing candle | Higher volume on the engulfing candle |
| Location | Found near support levels | Found near resistance levels |
Larger timeframes often provide more reliable signals, with daily and weekly charts typically showing stronger reversals compared to shorter timeframes. Ensuring all criteria are met is essential - overlooking even one can lead to false signals.
Common Mistakes to Avoid
Traders often make errors when interpreting engulfing patterns. Here are some of the most frequent mistakes and how to avoid them:
- Trading in Sideways Markets: Engulfing patterns need a clear preceding trend. For bearish engulfing patterns, avoid trading them in consolidation phases.
- Skipping Confirmation: Always wait for the next candlestick to confirm the signal before taking action.
- Pattern Misidentification: Be careful not to confuse engulfing patterns with similar formations like the Harami pattern. In an engulfing pattern, the second candle must completely cover the body of the first candle.
To improve the reliability of engulfing patterns, combine them with other technical indicators and always evaluate the broader market context. This approach helps reduce false signals and highlights better trading opportunities.
Trading with Engulfing Patterns
Trading engulfing patterns requires clear entry and exit strategies, along with disciplined risk management. Success comes from sticking to proven methods and using additional technical indicators for confirmation.
Trade Entry and Exit Rules
For a bullish engulfing pattern, consider entering a long position when the price moves above the high of the second engulfing candle, signaling a potential reversal of the downtrend. Use previous resistance levels as profit targets, or apply trailing stops to take advantage of extended price movements. For instance, in January 2012, Philip Morris (PM) stock rose from $76.22 to $77.32, confirming an uptrend continuation.
Risk Control Methods
Once your entry and exit points are defined, effective risk management is crucial. Here's an example using a bearish setup on Apple Inc. (AAPL):
- Entry price: $176.75
- Stop loss: $181.93 (set above the high of the engulfing candle)
- Target price: $170.59 (achieving a 2.5:1 risk reward ratio)
The stock later dropped by 3.4%.
| Risk Management Component | Strategy |
|---|---|
| Stop Loss Placement | Below the low for bullish patterns, above the high for bearish patterns |
| Position Sizing | Adjust based on your account's risk tolerance (commonly 1-2% per trade) |
| Risk Reward Ratio | Aim for at least a 2:1 ratio |
| Volume Confirmation | Higher volume on the engulfing candle strengthens the signal |
Combining Technical Indicators
You can improve the reliability of engulfing patterns by incorporating technical indicators. Popular tools include:
- Moving Averages (MAs) to confirm trend direction
- Relative Strength Index (RSI) to spot overbought or oversold conditions
- MACD for identifying momentum shifts and potential reversals
- Volume indicators to verify the strength of the pattern
For example, if the MACD shows divergence alongside a bearish engulfing pattern, it adds weight to the idea that momentum in the current trend is weakening.
Summary and Best Practices
Key Points to Remember
Trading engulfing patterns effectively depends on three main factors: size, location, and trend context.
| Key Component | Best Practice | Why It Matters |
|---|---|---|
| Timeframe Selection | Stick to H4 or higher | Provides stronger reversal signals |
| Pattern Quality | Ensure the pattern fully engulfs the previous candle | Increases the chances of success |
| Volume Confirmation | Look for higher trading volume | Confirms the strength of the reversal |
| Market Context | Focus on trending markets, avoid consolidation | Helps filter out false signals |
These elements form the foundation for making informed trading decisions.
Practical Trading Guidelines
Use the following steps to apply these principles in your trading:
Validating the Pattern:
- First, ensure the market is trending before searching for engulfing patterns.
- Wait for the next candlestick to confirm the pattern's signal.
- Always set stop loss levels as outlined earlier.
- Use nearby support and resistance levels to define your profit targets.
Managing Risk Effectively:
- Focus on trading engulfing patterns at pullback extremes to align with trend continuation.
- Avoid trading during consolidations, as these often lead to unreliable signals.
- Combine engulfing patterns with other technical tools to strengthen your analysis.
- Pay attention to volume spikes during the formation of the pattern for extra confirmation.


