

Explore the Evening Star and Abandoned Baby candlestick patterns, their recognition, trading strategies, and effective risk management tips.
- Evening Star: A common 3-candle pattern signaling bearish reversals in uptrends. Success rate: ~72%.
- Abandoned Baby: A rare but powerful 3-candle pattern with isolated gaps. Success rate: 65%. Median return: -3% over 20 days.
You can leverage LuxAlgo’s Price Action Concepts toolkit on TradingView to automatically identify these reversal setups.
Key Features:
- Evening Star: Large bullish candle → Small indecisive candle → Large bearish candle.
- Abandoned Baby: Strong candle → Doji with a gap → Opposite strong candle.
Quick Comparison:
| Pattern | Frequency | Success Rate | Typical Return | Key Market Use |
|---|---|---|---|---|
| Evening Star | Common | ~72% | Varies | Bearish reversals |
| Abandoned Baby | Rare (50/20 yrs) | 65% | -3% (20 days) | Strong trend shifts |
Pro Tips: Use RSI, MACD, or volume analysis for confirmation. Stick to trending markets for higher accuracy.
Ready to dive into the details? Let’s break it down further.
What is an Evening Star – Candlestick Pattern Guide
Evening Star Pattern Recognition
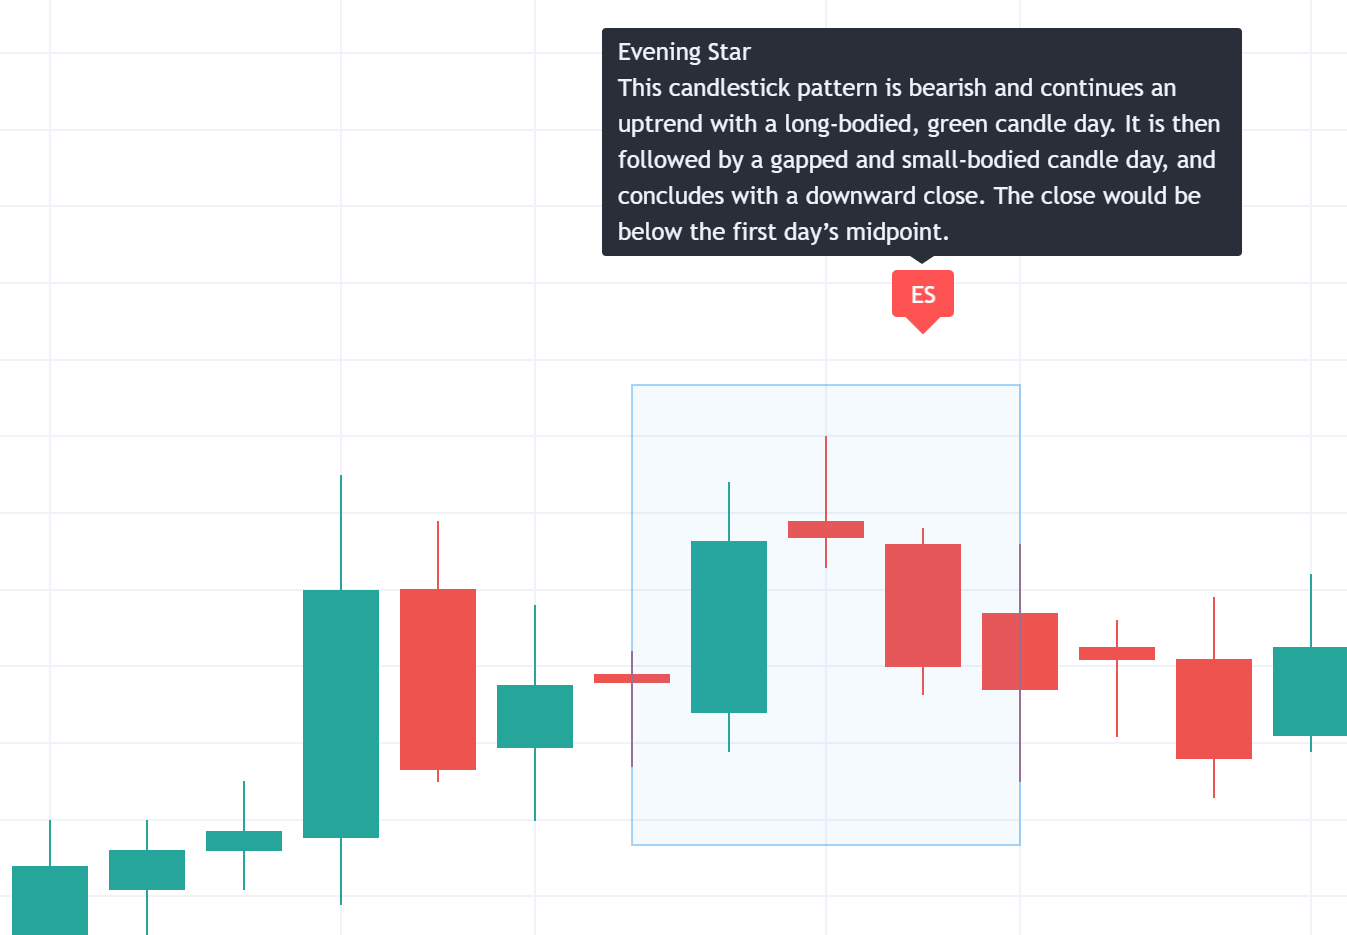
The Evening Star is a well-known reversal pattern with a ~72% success rate. Recognizing its three-part structure accurately is key for making informed trades.
3 Parts of the Evening Star
This pattern is made up of three specific candlesticks that reflect a shift in market sentiment from bullish to bearish:
| Candle | Characteristics | Market Significance |
|---|---|---|
| First | Large bullish candle | Shows strong buying pressure and upward momentum |
| Second | Small body (doji or spinning top) | Signals indecision and weakening upward momentum |
| Third | Large bearish candle | Indicates sellers gaining control and potential reversal |
A deep penetration by the third candle confirms sellers are taking charge.
Pattern Identification Guide
- Clear uptrend before the pattern develops
- Second candle often gaps up from the first (less common in FX)
- Third bearish candle typically shows higher volume
- Use RSI or MACD to confirm the signal
Common Pattern Mistakes
Misidentifying the Evening Star is a frequent error. Ensure market conditions align before acting:
- Confirm uptrend via trendlines or moving averages
- Check volume expansion with OBV or VWAP
- Wait for full close of the third candle
- Ensure the third candle breaks key support
- Use RSI or MACD for extra confirmation
"A powerful reversal indicator: the Evening Star is a reliable signal for bearish reversals, often appearing at the peak of uptrends."
Abandoned Baby Pattern Recognition

The Abandoned Baby is a three-candle signal that suggests strong reversal potential when it appears, thanks to its strict non-overlapping gaps.
Pattern Structure
| Component | Bearish Pattern | Bullish Pattern |
|---|---|---|
| First Candle | Strong bullish | Strong bearish |
| Middle Candle | Doji gapping above | Doji gapping below |
| Final Candle | Bearish candle gapping down | Bullish candle gapping up |
Bearish vs Bullish Variations
- Bearish: Occurs in an uptrend when the doji gaps above.
- Bullish: Occurs in a downtrend when the doji gaps below.
Pattern Confirmation
- Volume Analysis: High volume on candles 1 & 3, lower on the doji.
- Technical Indicators: Look for MACD divergence, RSI near extremes, price at key S/R.
- Market Context: Best at significant levels or within strong trends.
Performance Insights
Historic data shows ~65% success for the bearish version over 20 days, but it misses targets ~43% of the time—highlighting risk management importance.
Trading Both Patterns
Clear entry, exit, and risk rules are essential once the patterns are identified.
Trade Entry & Exit Rules
| Pattern Type | Entry Point | Stop Loss | Profit Target |
|---|---|---|---|
| Bullish Abandoned Baby | After third candle in downtrend | Below doji’s low | 2–3× risk |
| Bearish Abandoned Baby | After third candle in uptrend | Above doji | 2–3× risk |
| Evening Star | At close of third candle | Above second candle’s high | Previous support levels |
Risk Management Steps
- Position Sizing: Risk ≤ 2% of capital per trade.
- Stop Loss Placement: Just beyond entry candle extremity.
- Profit Targets: Aim for ≥ 2:1 reward-to-risk or key S/R zones.
Adding Technical Indicators
| Indicator | Use Case |
|---|---|
| Moving Averages | Confirm pattern direction |
| RSI | Spot overbought/oversold |
| Volume Analysis | Confirm spikes on key candles |
| MACD | Identify divergences |
Combining multiple tools refines strategy and boosts confidence in your trades.
Pattern Analysis Methods
Timeframe Analysis
| Timeframe | Best Use Case | Reliability |
|---|---|---|
| Weekly/Daily | Swing trading, major reversals | High |
| 4-hour | Intraday positions | Moderate |
| 1-hour | Day trading | Lower (more false signals) |
Volume Analysis
| Stage | Volume | Significance |
|---|---|---|
| First Candle | Low–Moderate | Pattern start |
| Second (Doji) | Lower | Indecision |
| Third Candle | High spike | Confirms reversal |
Market Context
- Check major support & resistance.
- Align with higher-timeframe trends.
- Consider upcoming economic events.
Conclusion
Pattern Overview
The Evening Star offers a clear three-candle reversal signal, while the Abandoned Baby’s gap isolation highlights its strength as a reversal indicator.
Trading Tips
- Placement: Ensure patterns form in established trends.
- Stop-Loss: Just beyond pattern extremes.
- Confirmation: Look for RSI/MACD signals and full candle closes.
- Automation: Use LuxAlgo’s alerting features to catch patterns in real time.


