
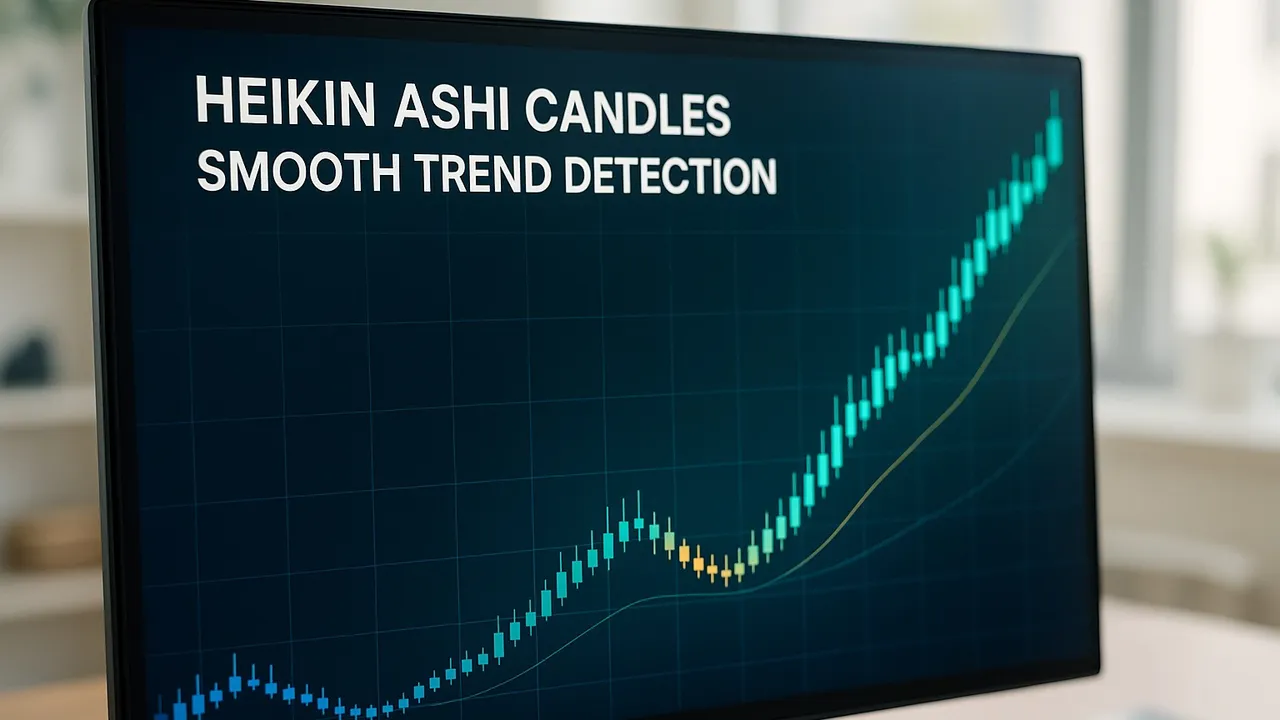
Heikin Ashi candles offer a simplified approach to trend analysis, reducing market noise and enhancing trading decisions for greater clarity.
Heikin Ashi candlesticks simplify trend analysis by averaging price data, making it easier to identify market trends and reduce noise. Unlike traditional candlesticks, Heikin Ashi candles provide smoother visuals, which help traders spot strong trends and avoid false signals. Here's what you need to know:
- Smoother Trends: Heikin Ashi uses averaged prices to highlight sustained trends.
- Key Patterns:
- Strong Uptrend: Green candles with no lower shadows.
- Strong Downtrend: Red candles with no upper shadows.
- Consolidation: Small candles with shadows on both ends.
- Key Benefits:
- Reduces market noise during high volatility.
- Simplifies trend detection for better decision-making.
- Integration with Indicators: Combine moving averages (e.g., 9, 21, 50, 200 MA) with LuxAlgo toolkits for enhanced analysis.
Quick Comparison
| Feature | Heikin Ashi Charts | Traditional Candlestick Charts |
|---|---|---|
| Price Calculation | Averaged prices | Actual prices |
| Trend Clarity | High | Lower |
| Noise Reduction | High | Lower |
| Ease of Use | Intuitive for trends | Requires more interpretation |
This method is ideal for traders seeking clear trend signals and reduced complexity in volatile markets.
Core Mechanics of Heikin Ashi
Price Calculation Method
Heikin Ashi candles smooth out price data by averaging it, creating clearer patterns for trend analysis. The calculations for each candle are as follows:
| Component | Calculation Formula |
|---|---|
| Open | (Previous HA Open + Previous HA Close) ÷ 2 |
| Close | (Open + High + Low + Close) ÷ 4 |
| High | Maximum of (High, HA Open, HA Close) |
| Low | Minimum of (Low, HA Open, HA Close) |
These formulas help create a visual representation that simplifies identifying trend strength and direction.
Reading Trend Signals
Heikin Ashi candles provide straightforward visual indicators of trends:
| Trend Type | Visual Traits | Trend Strength |
|---|---|---|
| Strong Uptrend | Green candles without lower shadows | Large bodies |
| Weak Uptrend | Green candles with both shadows | Smaller bodies, longer shadows |
| Strong Downtrend | Red candles without upper shadows | Large bodies |
| Weak Downtrend | Red candles with both shadows | Smaller bodies, longer shadows |
To enhance trend analysis, traders often incorporate moving averages:
- Use 9 & 21 EMA for short-term trend validation.
- Observe the 50 MA for medium-term direction.
- Rely on the 200 MA for confirming long-term trends.
These indicators, combined with Heikin Ashi, can provide a more comprehensive view of market movements.
Spotting Market Shifts
Consolidation phases are marked by Heikin Ashi candles with small bodies and visible shadows, signals of reduced momentum. Recognizing these patterns helps traders anticipate potential breakouts, offering valuable insight into upcoming market activity.
Heikin-Ashi Candlesticks Tutorial... Learn How to Read Heikin ...
Key Benefits for Traders
Heikin Ashi charts offer a streamlined approach to trading by providing clearer insights and actionable signals.
Noise Reduction Features
Heikin Ashi candles simplify market analysis by averaging price data, which helps cut through market noise. This approach creates a more stable view that:
- Highlights sustained trends
- Minimizes false signals during choppy market conditions
- Helps traders maintain positions through minor counter-trend moves
This smoothing effect is particularly useful during volatile periods when standard charts might present confusing or erratic patterns.
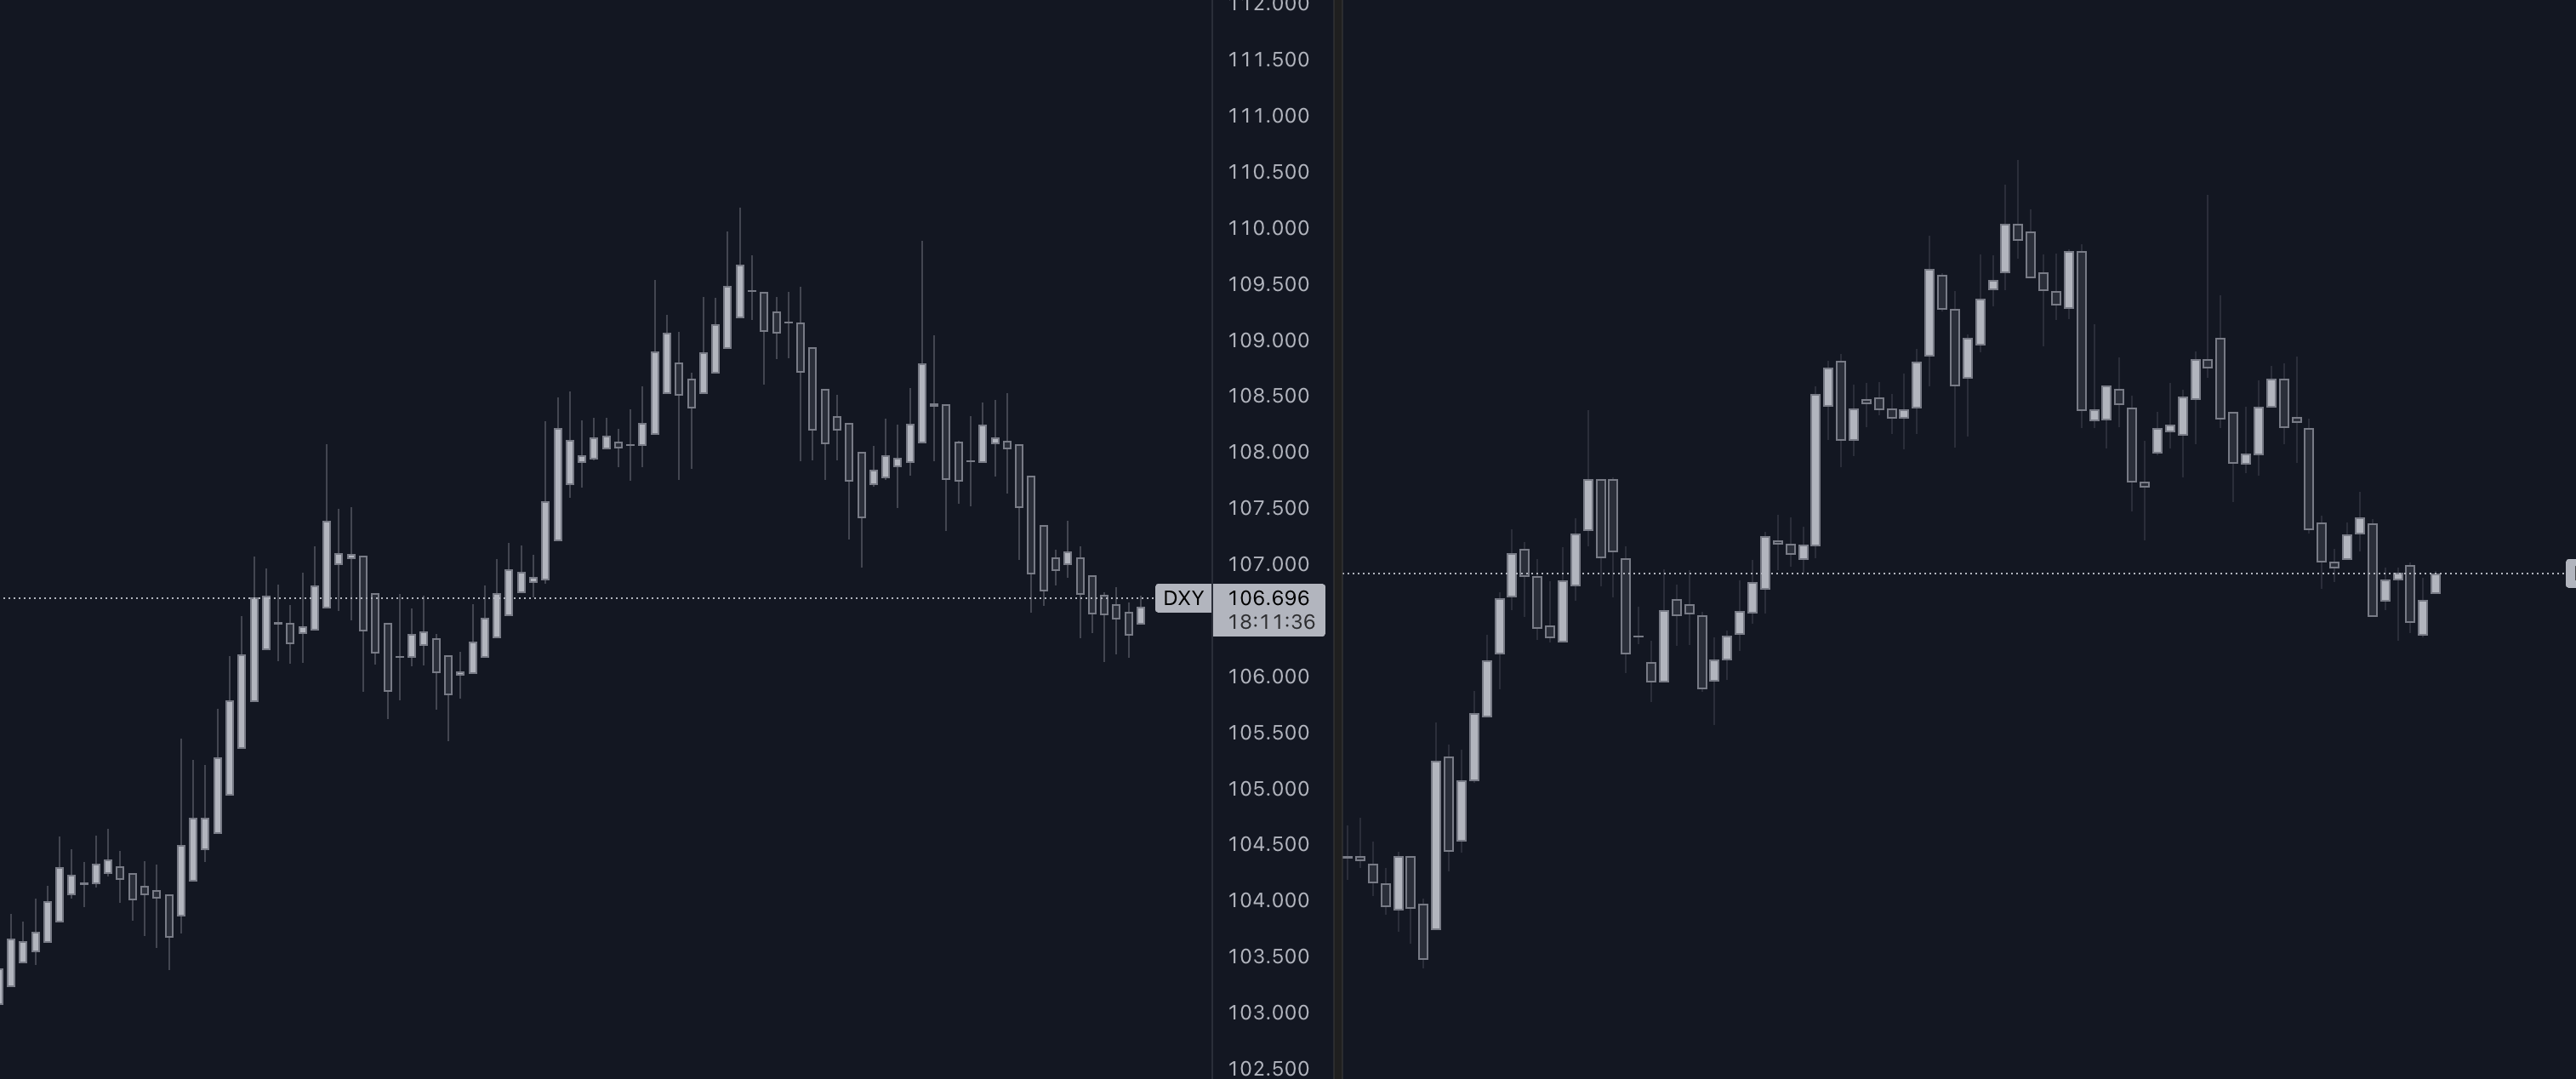
Chart Type Comparison
Recognizing the differences between Heikin Ashi and standard candlestick charts can help traders choose the best chart style for their strategy:
| Feature | Heikin Ashi Charts | Standard Candlestick Charts |
|---|---|---|
| Signal Clarity | Clear trend signals | Raw price action |
| Pattern Simplicity | Simplified trend patterns | Complex formations |
| Ease of Use | Intuitive and user-friendly | Requires more interpretation |
| Real-Time Feedback | Slight delay due to averaging | Immediate price updates |
This comparison highlights Heikin Ashi's advantages in identifying trends and simplifying chart patterns.
Improved Trading Decisions
Heikin Ashi charts provide traders with clear visual cues about trend strength. For example:
- Strong uptrends: Green candles with no lower shadows
- Weakening uptrends: Candles with both upper and lower shadows
- Strong trends: Large candle bodies with minimal opposing shadows
- Weakening trends: Smaller bodies with shadows on both ends
These visual signals make it easier to set up strategic trades and react confidently to market movements.
Trading Strategy Implementation
Heikin Ashi candles simplify trend analysis, making it easier to execute trades effectively. Here's how you can apply them in your trading strategies.
Trade Entry and Exit Rules
Heikin Ashi candles provide clear signals for entering and exiting trades:
| Trend Type | Entry Signal | Exit Signal |
|---|---|---|
| Uptrend | Green candles with no lower shadows | First red candle appears |
| Downtrend | Red candles with no upper shadows | First green candle appears |
| Consolidation | Small bodies with shadows | Wait for a clear directional move |
These rules can serve as a foundation for incorporating other indicators into your strategy.
Integrated Analysis
To strengthen your analysis, combine Heikin Ashi with additional indicators:
- Volume: High volume during the start of a trend confirms its strength.
- Moving Averages: Use different moving averages to identify trends and signals:
| Moving Average Setup | Purpose | Signal Type |
|---|---|---|
| 9 & 21 EMA | Tracks short-term trends | Quick entries/exits |
| 50 MA | Identifies medium-term trends | Confirms trend direction |
| 200 MA | Highlights long-term trends | Acts as support/resistance |
- Support and Resistance: Pay attention to flat-topped or flat-bottomed candles near key levels, as they often hint at potential reversals.
Risk Management Guidelines
Once you've confirmed your trend signals, manage your risk with these steps:
- Place stop-loss orders just beyond the previous swing low or high, and adjust position sizes to account for market volatility.
- Use the 100-period moving average to filter out trades that go against the trend.
- Reduce your exposure during highly volatile market conditions.
- Continuously monitor Heikin Ashi patterns at important support and resistance levels to refine your strategy.
LuxAlgo Integration Guide
LuxAlgo Tools Overview
LuxAlgo's toolkits are designed to simplify Heikin Ashi trend analysis. The Price Action Concepts (PAC) toolkit integrates with Heikin Ashi charts to pinpoint key reversal patterns and shifts in market structure. By leveraging Heikin Ashi's smoothing effect, PAC helps traders identify setups with higher potential.
The Oscillator Matrix toolkit complements Heikin Ashi analysis by offering:
| Feature | How It Works with Heikin Ashi |
|---|---|
| Real-time Divergence Detection | Highlights trend strength or weakness |
| Money Flow Insights | Confirms volume pressure within trends |
| Trend-Following Signals | Provides additional confirmation for Heikin Ashi trends |
These toolkits provide a foundation for refining trading strategies.
Advanced Analysis Tools
LuxAlgo’s AI Backtesting Assistant fine-tunes Heikin Ashi strategies for various timeframes and market conditions. The platform’s screening tools make it easier to spot Heikin Ashi patterns across different markets, giving traders a clearer view of potential opportunities.
"Lux Algo has really stepped my trading up, there is a setup for any style of trading you prefer which is very nice, you don't have to put yourself in a box metaphorically speaking." - Kevin Ortega
With the screening system, traders can:
- Set Custom Alerts: Get notified when specific Heikin Ashi patterns appear.
- Filter Market Conditions: Focus on markets with ideal trending setups.
- Track Multiple Assets: Monitor pattern formations across various markets.
To unlock these features, explore LuxAlgo’s plans below.
Subscription Options
| Plan | Monthly Cost | Features for Heikin Ashi Analysis |
|---|---|---|
| Free Plan | $0 | Access hundreds of free indicators in the LuxAlgo Library |
| Premium | $39.99 | Advanced signals, alerts, and oscillator tools on TradingView |
| Ultimate | $59.99 | Includes AI Backtesting Assistant plus all Premium features |
"Hands down BEST indicators you can find... The cool thing is, they make videos and walkthroughs of literally every indicator and setting and what it does." - Eric Bland
All plans come with 24/7 support and regular updates to ensure a smooth experience.
Summary
Benefits of Heikin Ashi Candles
Heikin Ashi candles are excellent for identifying market trends due to their smoothing effect, which reduces market noise. Strong trends are characterized by large, continuous candles (green for uptrends, red for downtrends), while smaller candles with shadows indicate weaker trends or periods of consolidation. These clear signals provide a solid basis for making informed trading decisions.
Advantages of LuxAlgo Toolkits
LuxAlgo enhances Heikin Ashi analysis with features like automated pattern detection and strategic alerts. The PAC toolkit highlights key patterns and market-structure shifts, while the Oscillator Matrix toolkit offers real-time divergence detection and money-flow insights.
LuxAlgo toolkits simplify Heikin Ashi analysis by automating pattern recognition, providing real-time signal confirmation, and improving trade management through AI-driven backtesting. Custom alerts ensure traders stay updated on critical setups, while flexible plan options let users choose features that match their trading preferences.
"Lux Algo has really stepped my trading up, there is a setup for any style of trading you prefer which is very nice, you don't have to put yourself in a box metaphorically speaking." - Kevin Ortega
"Hands down BEST indicators you can find... The cool thing is, they make videos and walkthroughs of literally every indicator and setting and what it does." - Eric Bland
FAQs
What makes Heikin Ashi candles better for spotting trends compared to traditional candlestick charts?
Heikin Ashi candles are designed to simplify trend detection by smoothing out market noise. Unlike traditional candlestick charts, which reflect every price movement, Heikin Ashi uses averaged price data to create a clearer picture of trends. This results in candles that often stay the same color during a sustained trend, making it easier to identify upward or downward momentum.
Traditional candlesticks can switch colors frequently, even during a strong trend, which may cause confusion. With Heikin Ashi, trends and potential reversals are more visually distinct, helping traders make more confident decisions in volatile markets.
How can I effectively use Heikin Ashi candles alongside moving averages for better trend analysis?
To make the most of Heikin Ashi candles in combination with moving averages, try these best practices:
- Short-term trends: Use the 9-period and 21-period exponential moving averages (EMA) to identify quick shifts in trend and refine your entry and exit points.
- Medium-term trends: Apply the 50-period simple moving average (SMA) to confirm the overall trend direction and identify potential support or resistance levels.
- Long-term trends: Use the 200-period SMA to highlight key areas of long-term support or resistance and ensure alignment with broader market movements.
By combining Heikin Ashi candles with moving averages, you can smooth out market noise, confirm trends more effectively, and make more confident trading decisions in volatile markets.
How do LuxAlgo toolkits improve trend analysis and trading strategies with Heikin Ashi candles?
LuxAlgo toolkits enhance trend analysis with Heikin Ashi candles by offering advanced features designed for precision and efficiency. These toolkits provide access to a wide range of trading indicators and an AI-powered backtesting platform, helping traders identify trends more effectively and refine their strategies.
One standout feature is the Multi-Chart Widget Indicator, which allows traders to view multiple charts simultaneously within a single interface. This makes it easier to analyze different timeframes or instruments side by side, complementing Heikin Ashi's ability to smooth out market noise. With LuxAlgo, traders can gain deeper insights and make more informed decisions, even in volatile market conditions.


