

Learn to enhance your trading strategy by effectively using moving averages alongside support and resistance levels for better decision-making.
Key Takeaways:
- Types of Moving Averages:
- Simple (SMA): Best for long-term trends, stable but slower to react.
- Exponential (EMA): Best for short-term trading, reacts quickly to price changes.
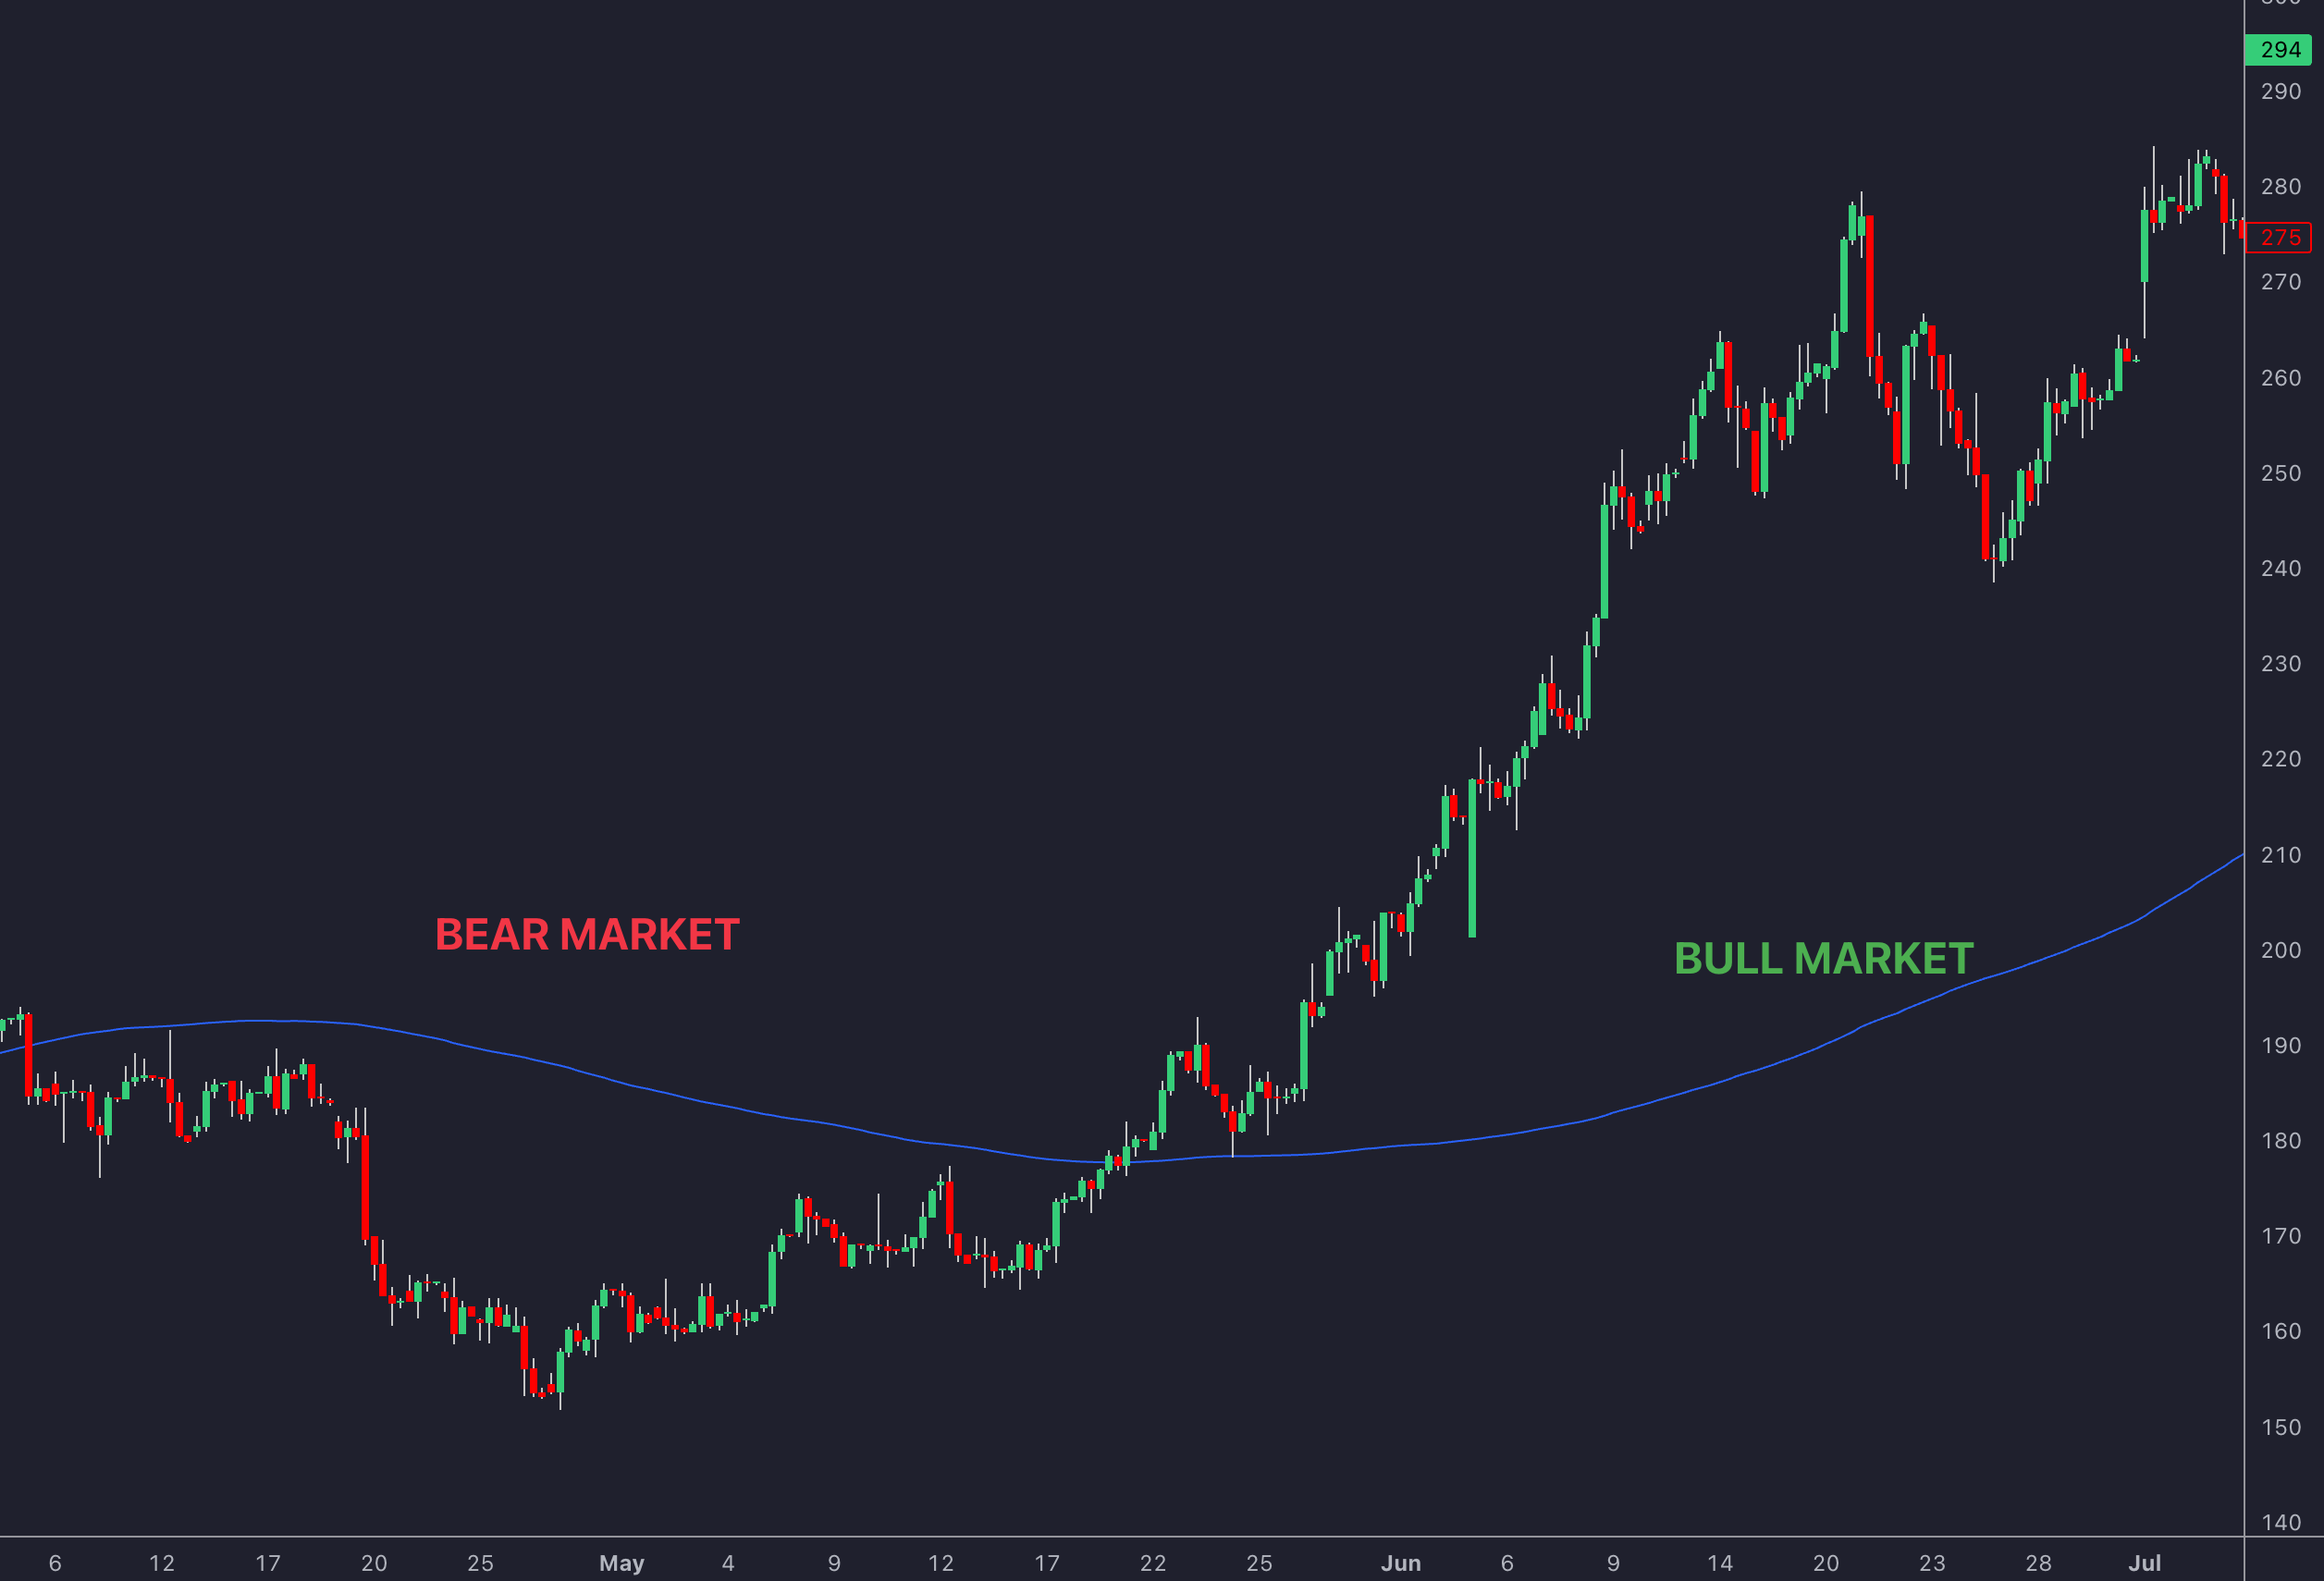
- Dynamic Support / Resistance: Moving averages like the 50-day and 200-day often align with key price zones.
- Golden Cross / Death Cross: Crossovers between the 50-day and 200-day MAs signal bullish or bearish trends.
- Trading Styles:
- Day traders use faster EMAs (e.g., 9/10, 21).
- Swing traders prefer longer SMAs (e.g., 50, 200).
Quick Comparison Table:
| Feature | SMA | EMA |
|---|---|---|
| Weight on Recent Prices | Equal | Higher |
| Best For | Long-term trends | Short-term trading |
| Speed of Reaction | Slower | Faster |
Tips:
- Combine moving averages with horizontal / diagonal support and resistance for stronger signals.
- Use charting platforms like TradingView or LuxAlgo’s Library indicators to analyze moving averages and align them with price action.
- Test strategies with backtesting tools to ensure reliability under different market conditions.
This guide explains how to effectively use moving averages with support and resistance to improve your trading strategy.
Setting Up Moving Averages
Choosing Time Periods
Match your moving-average periods to your trading style. Faster EMAs work well for day trading, while longer SMAs are better suited for swing trading.
| Trading Style | Recommended Moving Averages | Best Use Case |
|---|---|---|
| Day Trading | 9/10 EMA, 21 EMA, 50 EMA | Quick signals and trend direction |
| Swing Trading | 20/21 SMA, 50 SMA, 200/250 SMA | Following longer-term trends |
"The 10-day exponential moving average (EMA) is my favorite indicator to determine the major trend. I call this 'red light, green light' because it is imperative in trading to remain on the correct side of a moving average to give yourself the best probability of success. When you are trading above the 10-day, you have the green light, the market is in positive mode and you should be thinking buy. Conversely, trading below the average is a red light. The market is in a negative mode and you should be thinking sell." – Marty Schwartz
Creating Support / Resistance Zones
Moving averages often act as dynamic support or resistance levels. The 200-day moving average is especially important. Since 1960, the S&P 500 has stayed above this level 70 % of the time, rising to 85 % since 2010.
"My metric for everything I look at is the 200-day moving average of closing prices. I've seen too many things go to zero, stocks and commodities. The whole trick in investing is: 'How do I keep from losing everything?' If you use the 200-day moving average rule, then you get out. You play defense, and you get out." – Paul Tudor Jones
A great example of this was in the oil market during 2020. Traders exited around $65 in January and re-entered near $40 in October–November, guided by the 200-day moving average. These levels are crucial for understanding price behavior and timing trades.
Platform Setup Guide
Platforms like TradingView provide excellent tools for analyzing moving averages. For more advanced setups, LuxAlgo’s AI Backtesting Assistant can help identify clusters where multiple moving averages align, forming stronger support and resistance zones.
To set up your charts effectively:
- Start with the key moving averages that match your trading timeframe.
- Use color coding to differentiate between time periods.
- Combine EMAs and SMAs for more reliable signals.
- Adjust settings based on the asset’s volatility.
Keep your settings consistent but flexible. EMAs provide faster alerts but may give false signals, while SMAs are slower but more dependable. Pay attention to how price action interacts with these averages to fine-tune your trade setups.
Price Action Near Moving Averages
Reading Bounces and Breakouts
Price action near moving averages can provide valuable clues about potential trend changes. A breakout happens when the price moves through a moving average with strong volume, and the slope of the moving average helps confirm the trend’s direction.
Here are some common patterns to watch for:
| Price Action Pattern | Signal Type | Confirmation |
|---|---|---|
| Price Break Above MA | Bullish | Strong volume + upward MA slope |
| Price Break Below MA | Bearish | Strong volume + downward MA slope |
| Price Bounce Off MA | Continuation | Matches the direction of the trend |
To reduce the risk of acting on false signals, it’s better to wait for end-of-day confirmation instead of making snap decisions. These price movements work well when paired with moving-average crossovers, offering more evidence of trend changes.
Moving Average Crossover Signals
Moving-average crossovers add another layer of confirmation when combined with support and resistance levels. The most impactful signals occur when shorter-term moving averages cross longer-term ones near important price levels.
Key crossover patterns include:
- Price crossing above or below a major moving average near established support or resistance.
- A shorter-term moving average crossing a longer-term one (often referred to as a Golden Cross or Death Cross).
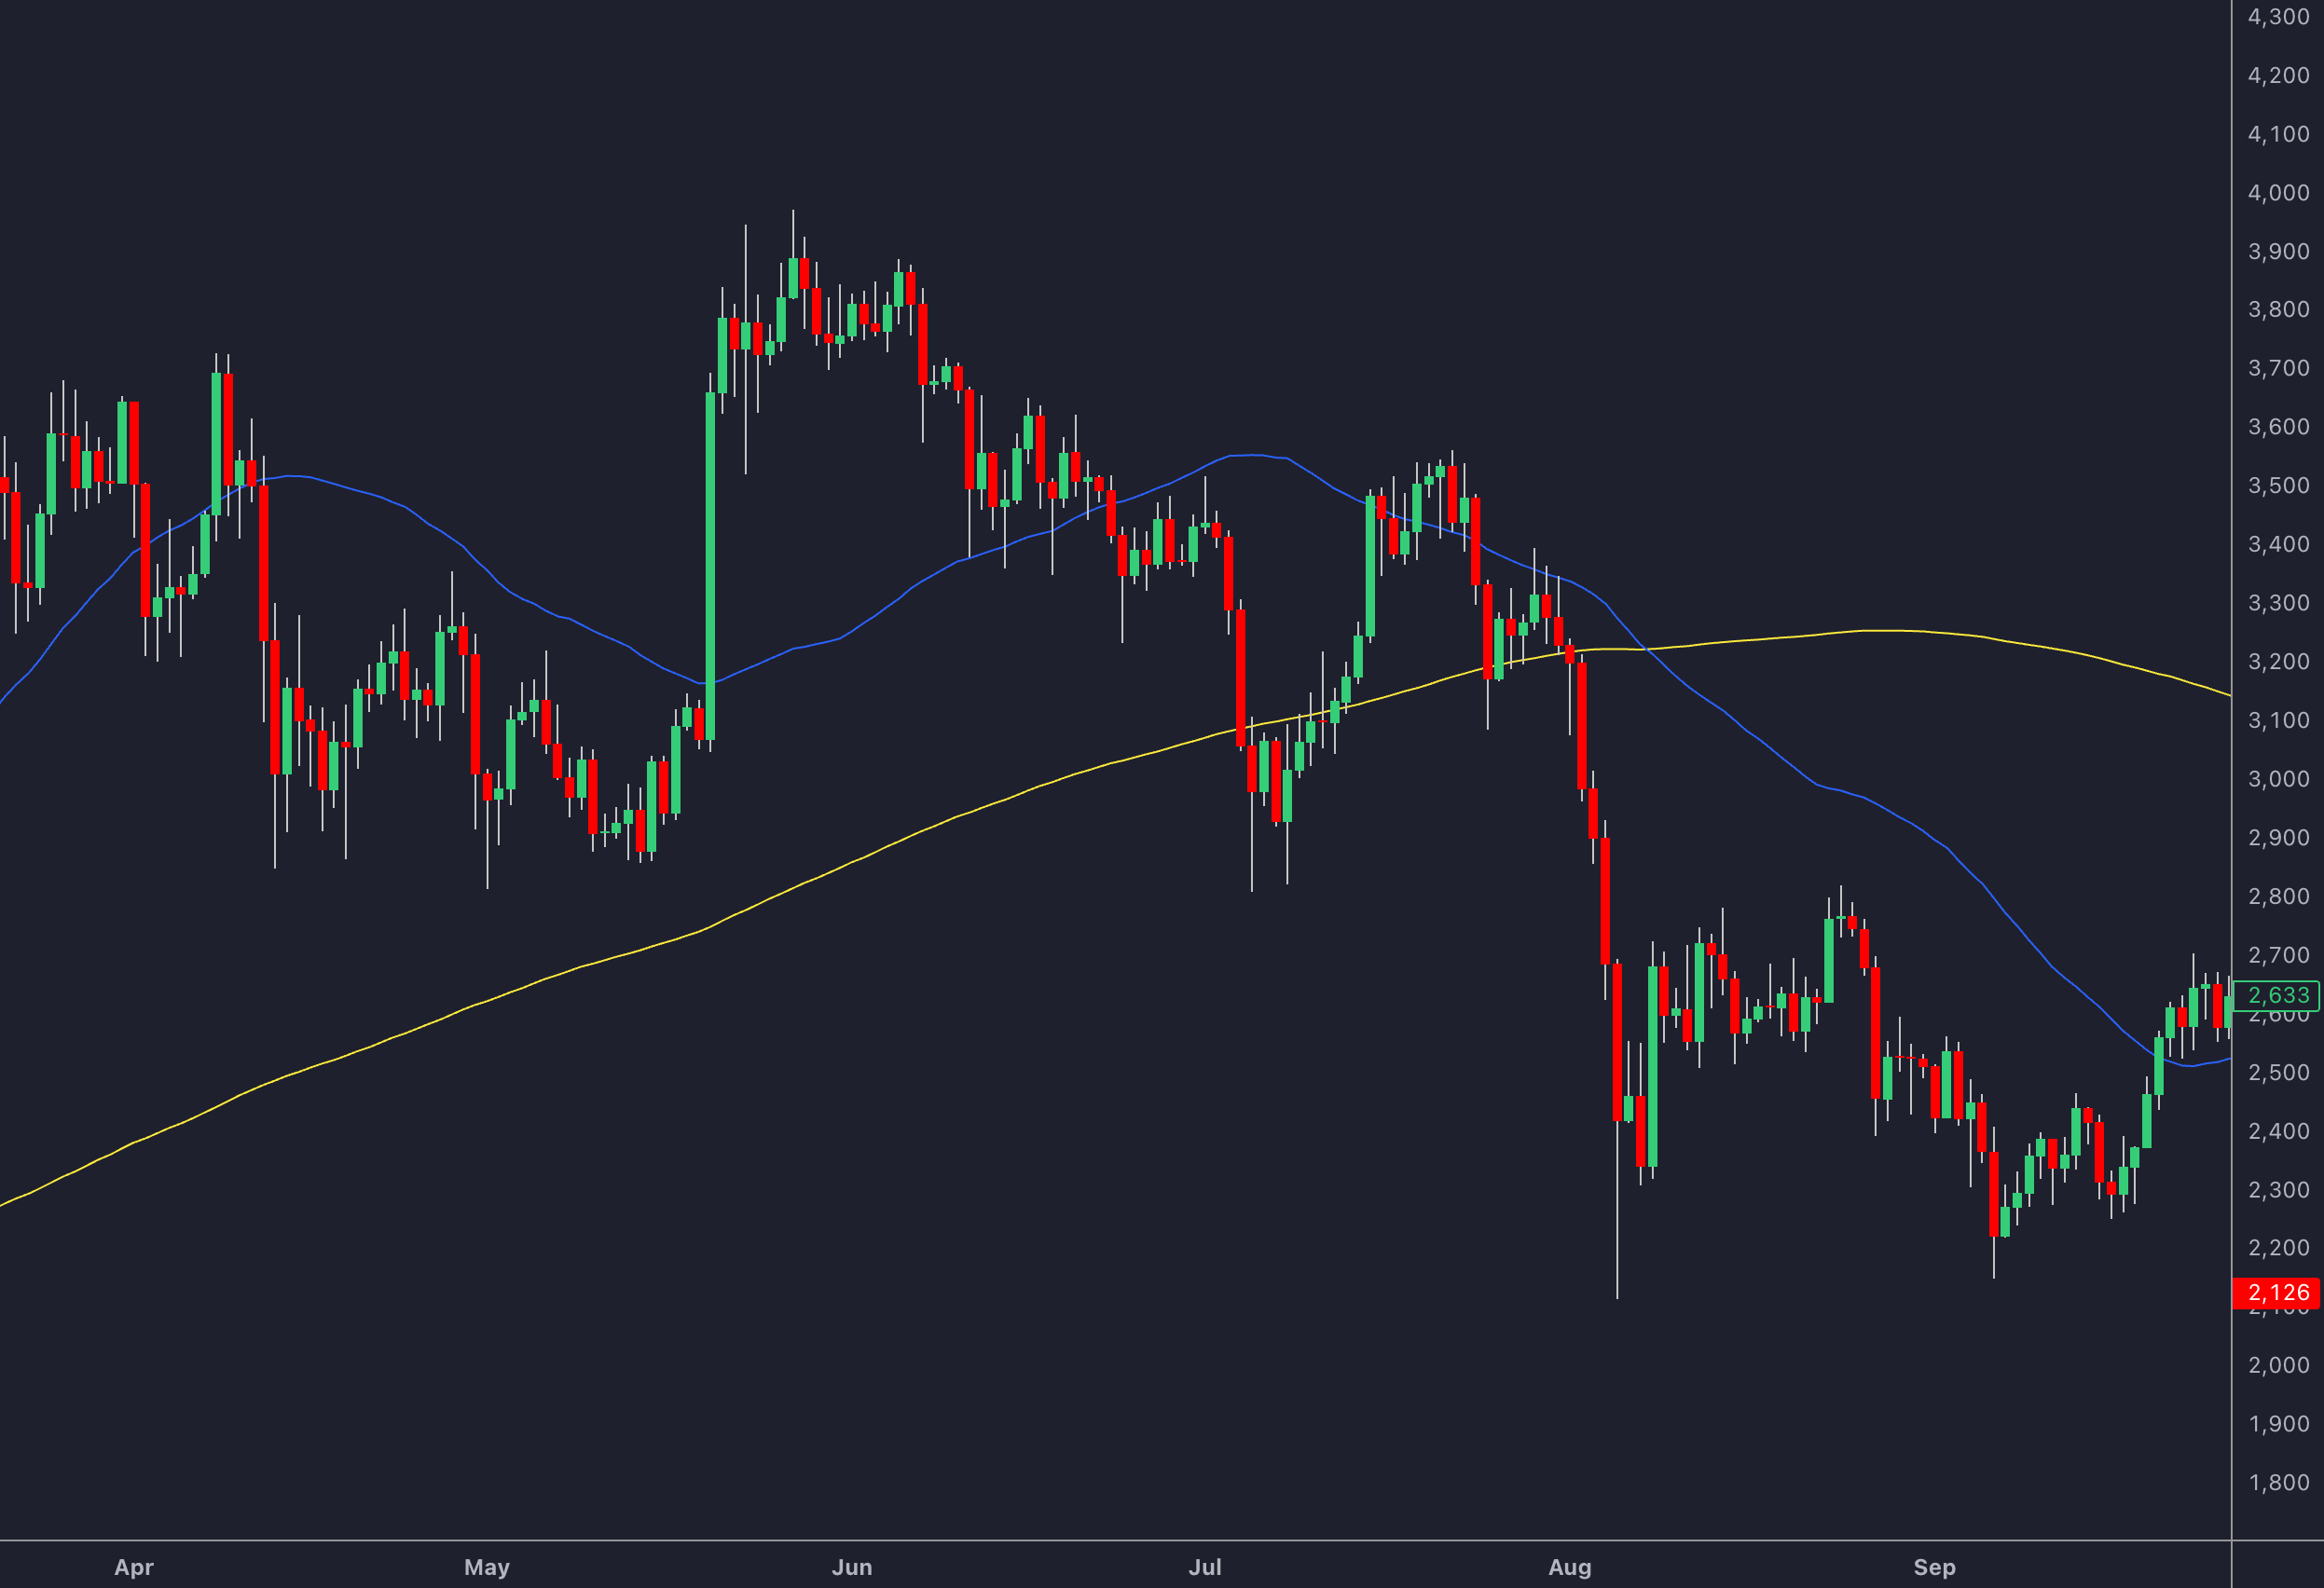
- Multiple moving averages converging at key price levels.
For better accuracy, combine these crossovers with other technical factors. A notable increase in volume during the crossover strengthens the signal. The most reliable setups often include:
- Price breaking through both a moving average and a key support or resistance level.
- A clear increase in trading volume.
- The slope of the moving average aligning with the breakout direction.
Tools like LuxAlgo’s indicators can help pinpoint these setups by identifying areas where multiple moving averages align with support and resistance levels, making it easier to spot high-probability opportunities.
Do Moving Averages Actually Work as Support and Resistance?
Trading Strategy Development
This section focuses on transforming insights from moving averages and support / resistance analysis into actionable trading strategies.
Entry and Exit Rules
Craft a strategy with well-defined entry and exit rules that incorporate moving averages and support / resistance levels.
For long trades, consider these criteria:
- Trend Confirmation
Ensure the 50-day moving average is above the 200-day moving average, signaling an uptrend. - Entry Signals
Look for price to bounce off the 50-day SMA on strong volume, align with horizontal support, and form a bullish candlestick. - Exit Parameters
Set profit targets at prior resistance levels, maintaining at least a 1:2 risk-reward ratio.
By establishing clear entry and exit rules, you can maintain consistency and align your approach with proper risk management.
Risk Management Guidelines
Managing risk effectively is key to protecting your capital. Use these guidelines:
| Risk Component | Rule | Why It Matters |
|---|---|---|
| Position Size | Risk no more than 1 % per trade | Preserves capital for future opportunities |
| Stop Loss Placement | Place 3–5 points below the moving average | Avoids being stopped out by normal price fluctuations |
| Take Profit Levels | Aim for 2–3 × the stop-loss distance | Helps achieve a positive long-term outcome |
When setting stop-loss orders, include a small buffer below the moving average to avoid exits caused by minor market noise.
Once these parameters are in place, test and refine your strategy to ensure it performs under different market conditions.
Strategy Testing Methods
Before trading live, thoroughly test your strategy. LuxAlgo’s AI Backtesting Assistant can help validate moving-average strategies using historical data. Focus on these areas:
- Performance Metrics
Analyze key metrics such as win rate, average risk-reward ratio, maximum drawdown, and profit factor. - Market Conditions
Test the strategy in various scenarios like trending markets, sideways consolidation, high volatility, and across different timeframes. - Signal Quality
Assess the reliability of entry and exit signals. Pay attention to false breakout frequency, the accuracy of moving-average crossovers, and how consistently support and resistance levels hold.
To improve signal accuracy, consider combining multiple moving averages (e.g., 10, 20, 50, 100, 200-day) with support and resistance levels. This approach can help filter out false signals and focus on stronger trading opportunities.
Troubleshooting and Tips
Reducing False Signals
False breakouts can drain your account quickly. To avoid this, always confirm signals before entering a trade.
Here are some ways to minimize false signals:
- Wait for confirmation: Only act after a candle closes beyond a support or resistance level.
- Use indicators: Validate breakouts with tools like MACD, RSI, and ATR to ensure the market’s momentum and volatility align.
- Follow the trend: Trade in the direction of the current trend to increase the odds of success.
Pay attention to volume. A strong volume surge during a breakout often confirms its validity, while low-volume breakouts tend to reverse quickly.
Market Condition Adjustments
Once you’ve addressed false signals, adjust your strategy to fit the current market environment. As detailed in our setup guide, fine-tune your moving-average settings based on market conditions:
| Market Type | Moving Average Settings | Key Focus |
|---|---|---|
| Strong Trend | 50 & 200 SMA | Look for pullbacks to moving-average support. |
| Choppy / Ranging | 10 & 20 SMA | Use shorter timeframes and smaller positions. |
| High Volatility | Multiple MAs (10, 20, 50) | Watch for convergence among moving averages. |
Adapting your approach ensures you’re better prepared for shifts in market behavior.
Tools for Better Results
Leverage advanced trading tools to improve your moving-average analysis. For example, LuxAlgo provides AI-powered indicators to reduce lag and highlight stronger support and resistance levels.
LuxAlgo’s complimentary Screeners can help traders:
- Analyze setups across multiple timeframes.
- Spot high-probability trades where moving averages align with critical price levels.
- Categorize assets by bullish or bearish trends using proprietary algorithms.
Combining these tools with higher-timeframe charts (like 4-hour or daily) reduces market noise and helps you focus on reliable trading opportunities.
Conclusion: Key Takeaways
Combining moving averages with support and resistance creates a solid approach for identifying reliable trade opportunities. This method provides clear trade signals while reducing noise.
Here are some key points:
- Moving averages can confirm traditional support and resistance levels, helping to filter out false signals and improve trade accuracy.
- Price movements around moving averages often indicate potential trend shifts or continuation patterns.
- Using multiple moving averages together can create broader zones that act as stronger areas of support or resistance.
It’s important to think of moving averages as zones rather than precise lines. For instance, the 50-day and 200-day SMAs for Microsoft have often marked key buying or selling areas.
If you’re looking to take this strategy further, LuxAlgo’s AI-powered indicators can help identify strong support and resistance levels across different timeframes, making it easier to integrate both dynamic and traditional indicators into your trading plan.


