
Explore the Ichimoku Cloud's five components for analyzing market trends, momentum, and support/resistance, enhanced by LuxAlgo's tools.
The Ichimoku Cloud, or Ichimoku Kinko Hyo, is a technical analysis framework that simplifies market trends by combining five key components on one chart. It helps traders analyze trends, momentum, and support / resistance levels.
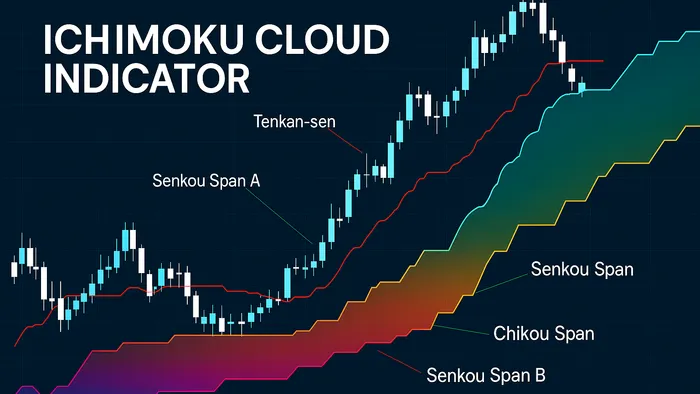
- Tenkan-sen: Tracks short-term momentum (9 periods).
- Kijun-sen: Identifies medium-term trends (26 periods).
- Senkou Span A & B: Form the “cloud” to project future support / resistance.
- Chikou Span: Confirms trends by comparing current and past prices.
Key Trading Signals
- Line Crossovers: Tenkan-sen crossing Kijun-sen signals potential trend changes.
- Price vs. Cloud: Price above the cloud indicates bullish trends, below signals bearish trends.
- Chikou Span: Confirms signals by comparing with past price levels.
LuxAlgo’s exclusive trading tools enhance the Ichimoku system by automating signals, backtesting strategies, and offering real-time alerts. The Ultimate plan ($59.99 / month) includes AI-driven features for refining trading strategies.
For traders, the Ichimoku Cloud provides a visual and actionable way to understand market trends. Use it with disciplined risk management to improve decision-making.
This New Ichimoku Indicator Is Almost Too Good…
The 5 Components of Ichimoku Cloud
The Ichimoku Cloud consists of five key elements designed to analyze trends, momentum, and support / resistance. Each component serves a specific purpose in understanding market behavior.
| Component | Time Period | Primary Function | Calculation Method |
|---|---|---|---|
| Tenkan-sen | 9 periods | Indicates short-term momentum | (Highest High + Lowest Low) ÷ 2 |
| Kijun-sen | 26 periods | Identifies medium-term trends / support / resistance | (Highest High + Lowest Low) ÷ 2 |
| Senkou Span A | 26 periods ahead | Leading cloud edge (projects future levels) | (Tenkan-sen + Kijun-sen) ÷ 2 |
| Senkou Span B | 52 periods (plotted 26 ahead) | Secondary cloud boundary (trend shifts) | (Highest High + Lowest Low) ÷ 2 |
| Chikou Span | 26 periods back | Confirms trends versus historical price | Current closing price |
1. Tenkan-sen: Short-Term Momentum Indicator
The Tenkan-sen reflects market momentum. A sharp slope indicates strong momentum, while a flat line suggests consolidation.
2. Kijun-sen: Medium-Term Trend Indicator
The Kijun-sen highlights overall market trend and acts as dynamic support / resistance. A horizontal line suggests ranging prices, a slope signals trending conditions.
3. Senkou Span A: First Cloud Edge
Senkou Span A averages Tenkan-sen and Kijun-sen to project potential support / resistance ahead of price.
4. Senkou Span B: Second Cloud Edge
Working with Senkou Span A, it forms the Kumo (cloud) that highlights significant trend shifts and zones.
5. Chikou Span: Lagging Price Line
Chikou Span plots the current closing price 26 periods back, adding confirmation to trend direction.
Trading Methods with Ichimoku Cloud
The five components provide actionable trading signals through the Tenkan-sen, Kijun-sen, and cloud boundaries.
Line Crossover Trading Signals
When the Tenkan-sen crosses the Kijun-sen (a TK cross), it can signal potential trend reversals. Price interactions with the cloud add context.
| Signal Strength | Conditions | Suggested Action |
|---|---|---|
| Strong | Crossover occurs outside the cloud | Enter at the start of the next candle |
| Medium | Crossover occurs within the cloud | Avoid trading |
| Weak | Crossover goes against price trend | Do not trade |
Price and Cloud Interactions
Price location relative to the cloud helps confirm direction:
- Bullish Setup
- Price breaks above both cloud boundaries.
- Tenkan-sen and Kijun-sen slope upward.
- Place stop-loss within / below the cloud.
- Target resistance aiming for 1:2 risk-reward.
- Bearish Setup
- Price closes below the cloud.
- Tenkan-sen and Kijun-sen slope downward.
- Place stop-loss within / above the cloud.
- Target support with 1:2 risk-reward.
Chikou Span Trade Confirmation
The Chikou Span adds confirmation:
- Check its position against price 26 periods ago.
- Watch for crossovers with key price levels.
- Combine these observations with other components.
- Aggressive traders may enter when Chikou Span crosses price and cloud.
In February 2023, Apple (AAPL) printed a bullish signal when Chikou Span crossed above price and cloud, marking a seven-month uptrend.
LuxAlgo Exclusive Tools for Ichimoku Trading
LuxAlgo elevates Ichimoku trading with specialized resources that streamline analysis and execution.
Signals & Overlays Toolkit for Ichimoku
LuxAlgo’s Signals & Overlays toolkit simplifies Ichimoku signal detection by automating key indicators. Available through the Premium and Ultimate plans, it highlights Tenkan / Kijun crosses, cloud breakouts, and Chikou Span confirmations directly on TradingView.
| Feature | Purpose | How It Helps |
|---|---|---|
| Custom Alert Creator | Real-time notifications | Set entry / exit points |
| Pattern Detection | Highlights key formations | Saves analysis time |
| Signal Visualization | Displays clear indicators | Improves decisions |
AI Backtesting for Ichimoku Strategies
The AI Backtesting Assistant, part of the Ultimate plan ($59.99 / month), fine-tunes Ichimoku strategies using more than 6 million pre-tested scenarios.
- Strategy Optimization: Tests different Ichimoku settings.
- Performance Analytics: Provides metrics like win rate and risk-reward.
- Real-time Scanning: Monitors market conditions continuously.
- Custom Strategy Development: Guides traders in refining setups with AI assistance.
Community Strategy Resources
LuxAlgo’s active Discord community offers quick admin support, strategy sharing, and frequent updates based on user feedback.
"The team consistently improves the premium indicators based on community needs. The Discord is very active and the admins answer questions quickly. The community helps share new strategies and refine existing ones." — Kevin Ortega
Conclusion
The Ichimoku Cloud provides clear insights into trends, momentum, and support / resistance, yet long-term backtests show it lagged buy-and-hold in many cases.
LuxAlgo’s exclusive tools refine the system into a more precise instrument. The AI Backtesting Assistant, bundled with the Ultimate plan, enhances development by combining automated detection with customizable alerts.
- Watch cloud color changes as momentum clues.
- Confirm signals via price versus cloud and line crossovers.
- Use LuxAlgo’s automated setup identification for efficiency.
- Maintain disciplined risk management.
FAQs
How does the Ichimoku Cloud compare to other tools for analyzing market trends?
The Ichimoku Cloud offers a holistic chart that captures trend, momentum, and key price levels, giving deeper insights than many single-component indicators.
How can LuxAlgo’s AI-powered tools be combined with the Ichimoku Cloud to improve strategies?
Use LuxAlgo’s AI Backtesting to validate and optimize Ichimoku settings, while the Signals & Overlays toolkit automates alerting on key crosses and breakouts.
Is the Ichimoku Cloud effective in all market conditions?
It excels on daily, four-hour, and twelve-hour charts in trending markets. On lower timeframes, additional filters may be needed to avoid false signals.


