
Explore how the Klinger Oscillator combines price and volume analysis to identify market trends and reversals for more effective trading.
The Klinger Oscillator is a tool combining price movement and trading volume to identify trends and reversals. Created by Stephen J. Klinger in 1991, it calculates "volume force" to assess market strength, offering insights beyond price-based indicators. By using exponential moving averages (EMAs) of volume force, it highlights momentum shifts through crossovers, divergences, and zero-line movements.
Key takeaways:
- Volume Force links price direction with trading volume to measure market momentum.
- Crossovers between the main oscillator line and its signal line indicate potential entry/exit points.
- Divergences between price and the oscillator often signal trend reversals.
- Works best in trending markets with sufficient volume; less effective during consolidations or low-volume periods.
For improved accuracy, traders often pair it with other tools like RSI or moving averages. LuxAlgo provides TradingView indicators that can streamline analysis by automating signal detection, supporting systematic testing through AI Backtesting Assistant, and adding volume-focused context. While powerful, understanding its limitations - such as lag during sudden market shifts - is crucial for effective use.
How the Klinger Oscillator is Calculated
Understanding Volume Force
The Klinger Oscillator is built on a concept called Volume Force (VF), which combines price direction with trading volume to measure market strength. Essentially, VF captures the flow of money by analyzing where the closing price sits within the trading range.
The calculation begins with identifying the trend direction. If today’s high, low, and close are all higher than yesterday’s, the trend is considered positive. Otherwise, it’s negative. This simple comparison helps determine whether buyers or sellers are dominating the market.
Next comes the True Range, which measures actual price movement. To calculate this, the largest value is taken from these three options: the difference between today’s high and low, the gap between today’s high and yesterday’s close, or the gap between yesterday’s close and today’s low. This ensures that both overnight price gaps and intraday volatility are captured.
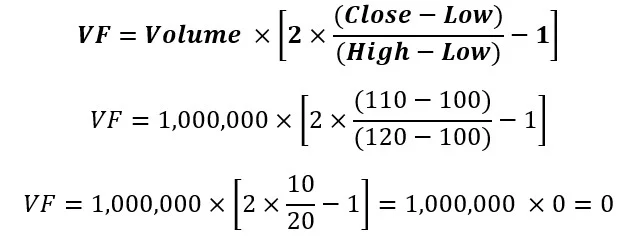
The Volume Force is then computed by multiplying the trading volume by a ratio. This ratio compares the price change (today’s close minus yesterday’s close) to the True Range. When prices close near the high of the range with strong volume, VF is positive. Conversely, when prices close near the low with heavy volume, VF turns negative. These values are the foundation for the moving average calculations that follow.
Formula Breakdown Step by Step
The Klinger Oscillator relies on a dual exponential moving average (EMA) system applied to the Volume Force values. By default, it uses a 34-period EMA and a 55-period EMA, but these settings can be adjusted to suit different trading styles and time horizons.
- Calculate the 34-period EMA for a more responsive measure of recent activity.
- Calculate the 55-period EMA for a smoother, longer-term perspective.
- Subtract the 55-period EMA from the 34-period EMA to create the main oscillator line. When the 34-period EMA is above the 55-period EMA, the oscillator reads positive, signaling that recent volume supports upward price movement.
To refine the signal, a 13-period EMA is applied to the main oscillator line. This creates a signal line that smooths out short-term fluctuations, making it easier to spot entry and exit points. The interaction between the main line and the signal line - such as crossovers - forms the basis for many trading decisions.
Reading Oscillator Values
The Klinger Oscillator moves above and below zero. Positive values suggest bullish short-term volume force, while negative values indicate bearish trends. The size of the oscillator values also holds meaning: higher positive readings reflect strong buying backed by significant volume, while lower negative readings point to intense selling pressure. However, extreme values don’t always signal immediate reversals, as they can persist during strong trends.
A crossover, where the main oscillator line rises above the signal line (the 13-period EMA), indicates strengthening momentum. Conversely, when it falls below, it signals weakening momentum or a potential reversal.
Divergences between price and the oscillator can also provide clues. For example:
- A bearish divergence occurs when price makes higher highs, but the oscillator doesn’t, hinting at a possible correction.
- A bullish divergence happens when the oscillator forms higher lows while the price makes lower lows, signaling a potential upward reversal.
These patterns, combined with the oscillator’s calculated values, offer traders a clearer picture of market momentum and potential turning points.
Using the Klinger Oscillator for Trading
Trend Confirmation and Reversal Signals
The Klinger Oscillator helps determine if a price trend is supported by trading volume. For instance, if stock prices are climbing but the oscillator stays flat or drops, it signals that the upward movement might lack volume support. This kind of volume-price divergence often hints at a potential trend weakening, giving traders a heads-up.
To confirm trends, the oscillator's movement should align with price direction. In strong uptrends, the oscillator typically shows positive values, with the main line staying above the signal line. Higher positive readings suggest robust buying activity, while persistent negative values point to strong selling pressure.
Reversals, on the other hand, often emerge when the oscillator diverges from price action. The zero line crossover is another key signal. When the oscillator moves from negative to positive territory, it indicates that recent volume supports upward price momentum. A drop below zero suggests the opposite - volume is backing downward pressure. However, these signals are most reliable when paired with other confirmation tools.
Common Signal Scenarios
Several scenarios highlight how the Klinger Oscillator can indicate trading opportunities:
- Crossover signals: When the oscillator’s main line crosses above the 13-period signal line, it suggests strengthening momentum supported by volume. Conversely, a bearish crossover - where the main line dips below the signal line - signals weakening momentum.
- Divergence patterns: These can be particularly telling. Bullish divergence occurs when prices drop but the oscillator forms higher lows, indicating a shift in volume toward buyers. Bearish divergence happens when prices rise, but the oscillator peaks lower, signaling dwindling buying interest.
- Extreme readings: Very high oscillator values may point to overbought conditions, while very low values often signal oversold markets.
The duration of signals is also crucial. Quick crossovers or divergences lasting just a few sessions are often unreliable. Patterns that persist for five to seven trading days are more likely to result in solid trading opportunities.
Combining the Klinger Oscillator with Other Tools
For better accuracy, the Klinger Oscillator works well when paired with other indicators. Combining it with price-based tools can confirm trends and highlight volume-price mismatches that signal potential weaknesses. Moving averages, for example, can establish the overall trend, while the oscillator checks if volume supports it.
Support and resistance levels add another layer of context. A bullish crossover near a strong support level carries more weight than one in the middle of a price range. Similarly, bearish signals near resistance levels tend to be more reliable. If you’re newer to these concepts, Investopedia’s overview of support and resistance is a solid reference.
Other momentum indicators, like the Relative Strength Index (RSI), can reinforce Klinger signals. When both tools point to similar trends - such as bullish divergence or overbought conditions - the signal gains strength. However, if the indicators conflict, it’s often wise to proceed with caution.
Chart patterns can also clarify oscillator readings. For instance, a triangle breakout paired with positive Klinger readings suggests the breakout has solid volume backing it. On the flip side, breakouts with negative readings may struggle to sustain momentum. Patterns like head and shoulders become more credible when the oscillator confirms weaker volume on the right shoulder compared to the left.
Finally, aligning signals across multiple timeframes - such as daily and weekly charts - can help filter out short-term market noise. Signals that appear consistently across timeframes are typically more reliable and offer higher-probability setups. Don’t forget to incorporate risk management measures, like adjusting stop-losses to account for market volatility.
Klinger Volume Oscillator Video Walkthrough
This video gives a practical walkthrough of how the Klinger Volume Oscillator is typically interpreted on charts, with an emphasis on spotting momentum shifts, reading crossovers, and understanding how volume context can help validate price moves. Use it as a visual companion to the calculation and signal sections above, especially if you prefer seeing examples rather than only reading formulas.
Using LuxAlgo on TradingView with the Klinger Oscillator

The Klinger Oscillator is a powerful tool on its own, but when combined with LuxAlgo’s TradingView indicators and workflows, it can become more time-efficient for traders who want consistent signal definitions across markets and timeframes.
Visualizing the Klinger Oscillator with LuxAlgo's Oscillator Matrix
LuxAlgo’s Oscillator Matrix expands volume-and-momentum analysis by adding structured trend and reversal context, including divergence-focused workflows designed for systematic chart review. Instead of manually scanning charts for mismatches between price and oscillators, traders can use the Matrix’s built-in components to keep a consistent process across timeframes.
The Matrix’s divergence-oriented analysis helps traders spot situations where price moves one way while momentum/volume-based readings fail to confirm. This is especially useful when you’re trying to distinguish between a strong continuation move and a trend that is losing participation.
Additionally, integrating money flow insights can add context around participation and pressure when the oscillator strengthens or weakens. This layered approach helps traders interpret whether a move is being supported by broad activity or is becoming more selective.
Optimizing Strategies with LuxAlgo Features
LuxAlgo provides several ways to refine Klinger Oscillator-style workflows:
- AI Backtesting Assistant: Use the assistant to test variations of signal rules and parameter settings across different market regimes. If you want to go deeper, the AI Backtesting Assistant docs explain how strategy creation and evaluation work.
- Screeners (TradingView): Screeners can help you find tickers that match a condition (for example, momentum strengthening after a pullback) so you spend less time manually scanning charts.
- Alert workflows: You can structure alerts so they only fire when multiple conditions align (e.g., strengthening momentum plus a key level), which can improve the quality of the opportunities you review. If you want a signal-focused companion, consider pairing with Battle Signals to keep trigger logic consistent.
- Strategy validation: After you define rules, validate them through systematic testing so you understand how signals behave across volatility spikes, trending periods, and consolidations.
Standalone vs. LuxAlgo-Enhanced Use
While the Klinger Oscillator is effective on its own, LuxAlgo can amplify its use by standardizing analysis and reducing manual steps. Here's a comparison:
| Aspect | Standalone Klinger | LuxAlgo-Enhanced |
|---|---|---|
| Signal Detection | Manual identification of signals | Structured alert workflows with customizable conditions |
| Multi-Asset Analysis | Requires reviewing charts manually | Screeners can narrow the list of charts to review |
| Strategy Testing | Limited to visual backtesting | Systematic testing with AI Backtesting Assistant |
| Market Context | Basic oscillator readings | Integrate momentum with price action context |
| Time Efficiency | Hours of manual work | More repeatable workflows and faster scanning |
| Accuracy | Relies on manual interpretation | Backtest-informed validation and rule consistency |
LuxAlgo can also help traders stress-test how oscillator-style rules behave in volatile conditions. For example, you can test whether adjusting moving-average lengths reduces whipsaws during consolidations, and whether adding a trend filter improves overall selectivity.
Best Practices and Limitations
Tips for Effective Use in U.S. Markets
In the U.S. stock market, trading volume often concentrates around the open and close of the regular session. Focusing analysis on regular trading hours - 9:30 AM to 4:00 PM ET - can improve reliability, while extended-hours sessions often have thinner liquidity and wider spreads. The NYSE lists its core trading hours on its official market information page.
The indicator performs best with large-cap stocks where institutional trading drives clearer participation. On the other hand, thinly traded names can produce erratic readings due to inconsistent volume. To counter this, traders might consider applying additional filters or confirmation tools to reduce noise and improve accuracy.
Understanding these operational nuances is essential before diving into the oscillator's inherent limitations.
Common Limitations and How to Address Them
One of the main challenges with the Klinger Oscillator is its tendency to generate false signals during periods of market consolidation. In sideways markets, frequent crossover signals often occur without a clear trend emerging. To address this, traders can combine the oscillator's signals with other technical indicators or wait for supportive price action to confirm trends.
Low-volume trading days or quiet market periods can also distort the oscillator's readings, sometimes exaggerating moves that don't align with broader market participation. To combat this, consider using relative volume filters or waiting for trading activity to return to normal levels.
Another drawback is the lag inherent in the Exponential Moving Averages (EMAs) used in the oscillator's calculation. During sudden market shifts - like flash crashes or unexpected news - the oscillator may not respond quickly enough. In such cases, pairing it with faster momentum indicators or using shorter timeframes can provide more immediate insights.
Sector-specific volume patterns also impact the indicator's effectiveness. For instance, stocks in sectors with consistently low trading volumes may yield less responsive readings compared to more active sectors. Adjusting thresholds or expectations based on the sector can help refine the analysis.
Finally, overnight price gaps can temporarily distort the oscillator's values. Large gaps at market open, for example, may cause misleading signals. Allowing the indicator time to stabilize after such events ensures more accurate readings.
By recognizing these limitations, traders can adapt their strategies and make more informed decisions.
Adapting the Klinger Oscillator to Different Timeframes and Assets
The Klinger Oscillator works well on daily and weekly charts in stock markets, providing clearer signals over these longer timeframes. While intraday charts (like 5-minute or 15-minute intervals) can be useful for day trading, stricter volume filters are necessary to minimize noise.
In the forex market, where volume is represented by tick data rather than centralized trade volume, the oscillator's reliability improves during high-activity periods - such as the overlap of the London and New York sessions.
Cryptocurrency markets, which operate 24/7, have distinct volume patterns compared to traditional markets. High-liquidity cryptocurrencies tend to produce more reliable signals, while smaller altcoins often lack sufficient volume for consistent analysis. Using longer timeframes, such as 4-hour or daily charts, can help smooth out the inherent volatility.
For commodity futures, it's important to account for contract rollovers. Using continuous contract data ensures consistency in analysis.
Options and derivatives present another challenge due to their unique volume characteristics. Instead of applying the oscillator directly to these instruments, it’s often more practical to analyze the underlying asset.
Finally, sensitivity adjustments are key. For shorter timeframes, tighter parameters can help capture quick movements, while smoother settings are better suited for longer-term analysis. Testing these configurations on historical data is a good way to find the optimal setup for different assets and timeframes.
Conclusion
The Klinger Oscillator brings together price and volume in a way that helps traders gain a deeper understanding of market trends, offering a more comprehensive view than traditional oscillators that rely solely on price. This combination equips traders with tools to navigate a variety of market scenarios with greater confidence.
What sets this indicator apart is its ability to calculate volume force, making it particularly useful for spotting shifts in buying and selling pressure before they become evident on price charts. Understanding its calculation not only sharpens signal interpretation but also allows traders to fine-tune its parameters for different market environments.
That said, the Klinger Oscillator works best when its strengths and limitations are acknowledged. It performs well in trending markets with adequate volume, but during periods of consolidation, pairing it with other confirmation tools can help reduce the risk of false signals. Its range of applications - from daily stock analysis to intraday trading - makes it a flexible choice for various trading strategies.
LuxAlgo builds on these capabilities by providing TradingView indicators and workflows for alerts, screening, and strategy evaluation. These additions can make it easier to identify higher-probability opportunities while still allowing you to keep discretionary control over trade selection and risk.
For traders in the U.S., the oscillator's focus on volume is particularly advantageous, given the high liquidity and accurate volume data available in American markets. Whether it's analyzing large-cap stocks during regular trading hours or adapting your workflow for forex during peak trading sessions, volume-based insights go beyond what price analysis alone can offer.
FAQs
How can I combine the Klinger Oscillator with other indicators to improve trading signals?
The Klinger Oscillator works well when paired with other technical indicators, offering a more nuanced approach to trading signals and trend confirmation. Common pairings include trend indicators like Bollinger Bands, RSI, MACD, or the Stochastic Oscillator. These additional tools can help verify the strength of a trend or spot potential reversals with greater precision.
Using multiple indicators together allows traders to get a broader perspective on market behavior, which can help minimize false signals. For instance, the Klinger Oscillator can highlight volume-based momentum, while the RSI can indicate whether an asset is overbought or oversold. Combining these insights leads to more confident and informed trading decisions.
What challenges does the Klinger Oscillator face in low-volume or sideways markets, and how can traders overcome them?
The Klinger Oscillator often struggles in markets with low volume or sideways movement because the volume data might not accurately represent the strength of a trend. This can result in misleading signals, making it harder to gauge market direction effectively.
To address this, traders often combine the Klinger Oscillator with other tools like price action analysis, trend lines, or complementary indicators such as the Relative Strength Index (RSI). Using these together helps validate signals and filter out unnecessary noise, especially during periods of low activity. This layered approach offers a clearer picture of market conditions, enhancing the accuracy of trading decisions.
How does LuxAlgo improve the Klinger Oscillator, and what benefits does it offer for traders?
LuxAlgo can complement Klinger-style analysis by pairing oscillator signals with a structured workflow. For example, traders often use a trend/reversal framework (like the Oscillator Matrix methodology) to keep criteria consistent for divergences, momentum shifts, and confirmation across multiple markets.
When combined with systematic testing via the AI Backtesting Assistant, traders can validate whether specific Klinger-based rules (such as crossover + trend filter, or divergence + level confirmation) hold up across different volatility regimes. This reduces guesswork and helps traders focus on the setups that historically behaved more reliably.
References
LuxAlgo Resources
- LuxAlgo | The AI Technical Trading Platform
- Volume Forecasting
- Reversal Signals (Oscillator Matrix docs)
- Trending Market Toolkit
- Range Detector
- AI Backtesting Assistant
- AI Backtesting Assistant Documentation
- Oscillator Matrix™
- Money Flow Profile
- Adaptive Momentum Oscillator
- The Key to Understanding RSI (Relative Strength Index)
- Battle Signals
- Price Action Concepts
- Sessions
- Market Structure Volume Distribution