
The biggest challenge with creating Pine Script® using AI has never been getting code on the screen. It has been knowing whether that code actually works on a real chart without constantly switching between tools, tabs, editors, and charting windows.
Traders using generic AI chatbots often run into the same workflow problem: ask for an indicator, copy the script, paste it somewhere else, check for errors, test it on a chart, come back with screenshots or revisions, and repeat the process until the idea finally behaves the way it should.
That back-and-forth slows down the entire creative process. Even when the code compiles, traders still need to visually confirm whether the signals, plots, labels, zones, and conditions match the idea they originally had in mind.
That is why the latest LuxAlgo Quant update matters.
Quant is no longer only an AI coding agent specialized in Pine Script for TradingView®. With this update, traders can now run indicator scripts directly inside Quant, visualize them with fully integrated charts, test across assets, and send chart snapshots back into the editor without leaving the workflow.
The result is a faster path from idea to chart-tested script.
Build, Run, and Review Indicators in One Place
Most AI coding workflows are still separated into disconnected steps.
You describe the indicator in one place. You receive the Pine Script output in another. Then you move to a charting environment to test the result. If the script needs adjustment, you return to the AI assistant, explain what changed, and start another cycle.
That workflow works, but it is inefficient.
The new Quant update changes this by bringing integrated chart visualization directly into the Quant experience. Instead of waiting until after the script is generated to see what it does, traders can run indicator scripts inside Quant and immediately review how the output behaves on a real chart.
For Pine Script development, that is a major shift.
Pine Script is visual by nature. Indicators are not just formulas. They are signals, overlays, labels, lines, shapes, plots, alerts, and visual logic placed directly on price. If the output does not look right on a chart, the script is not finished, even if the code technically compiles.
With integrated charts, Quant becomes more than a place to generate code. It becomes a faster environment for building, testing, and refining TradingView indicator ideas with AI.
Run Your Indicator Scripts Directly in Quant
Traders can also input their own Pine Script indicators into the platform from the start, visualize them on integrated charts, test how they behave across different assets, and use Quant as a coding assistant to improve the script from there.
This makes Quant useful whether you are starting with a fresh idea or bringing in an existing script that needs refinement. A trader can paste in an indicator, review the chart output, identify what needs to change, and ask Quant to help debug, restructure, simplify, or expand the logic.
This removes one of the most common friction points in Pine Script development. Instead of copying a script into a separate workspace just to see if the logic makes sense visually, Quant now supports a tighter loop where the script can be tested inside the same environment where it is being reviewed and improved.
That matters because real indicator development is rarely a one-shot process.
A trader might start with a basic trend-following idea, then add confirmation logic, change how signals appear, adjust sensitivity, add filters, or refine the way levels are drawn. Another trader might already have a working script but need help fixing an error, improving readability, adding new visual elements, or making the indicator easier to interpret on the chart.
Every edit needs to be checked visually. A signal that sounds useful in a prompt can still appear too late, too often, or too cluttered once it reaches the chart. An existing script can also compile successfully but still need improvements to its logic, styling, or user inputs.
By making scripts runnable directly inside Quant, LuxAlgo shortens the feedback loop between idea, code, chart behavior, and revision.
Instead of asking “does this script compile?” the better question becomes: “does this script behave the way I intended on the chart, and how can it be improved?”
That is the question this update is built around.
Fully Integrated Charts Inside Quant
Integrated charts are the biggest workflow improvement in this release.
For traders, chart context is everything. An indicator can only be judged properly when it is placed against real price action, different market conditions, and the visual structure it is designed to analyze.
With charts now built into LuxAlgo Quant, traders can move from prompt to output to visual review without jumping between tabs. This makes the experience feel closer to an AI indicator development environment than a standard chat-based coding assistant.
This is especially useful for scripts that depend heavily on visual elements, such as:
- Buy and sell signals
- Trend overlays
- Support and resistance zones
- Liquidity levels
- Market structure markers
- Volatility bands
- Labels, lines, and plotted conditions
- Custom confirmation systems
These features cannot be fully evaluated from code alone. Traders need to see whether the script is clear, readable, and useful on an actual chart.
Quant’s integrated chart workflow makes that review process much faster. You can generate an idea, run it, inspect the chart output, then ask Quant to refine the behavior based on what you see.
That makes iteration feel more natural. Instead of describing everything from memory, traders can respond to the actual chart result.
Test for Free Across 6,000+ Assets
A script that looks good on one chart is not always useful across different markets.
Trend-following logic may behave differently on stocks than on crypto. A volatility-based overlay may need different assumptions across forex, futures, commodities, or ETFs. A signal system that looks clean on a trending asset may become noisy in a sideways market.
That is why this update also introduces the ability to test indicator scripts for free across 6,000+ assets inside Quant.
This expands the usefulness of the workflow beyond single-chart validation. Traders can now review how their ideas respond across a much wider set of instruments before deciding whether an indicator is worth refining further.
For example, a trader building a momentum indicator can check whether the logic stays readable across different asset classes. A trader designing a price action overlay can see whether the script handles different levels of volatility. A trader creating a signal-based system can review whether the entries appear consistently or only work in one narrow market environment.
This does not replace proper testing, forward observation, or risk management. Traders who want to move from visual indicator development into deeper strategy testing can also explore LuxAlgo’s AI Backtesting Assistant for creating and evaluating trading strategies.
Instead of building in isolation, traders can test ideas against broader market behavior from the beginning.
Send Chart Snapshots to the Quant Editor in One Click
One of Quant’s strongest advantages has been its ability to work with visual trading ideas. The new chart snapshot workflow makes that even more direct.
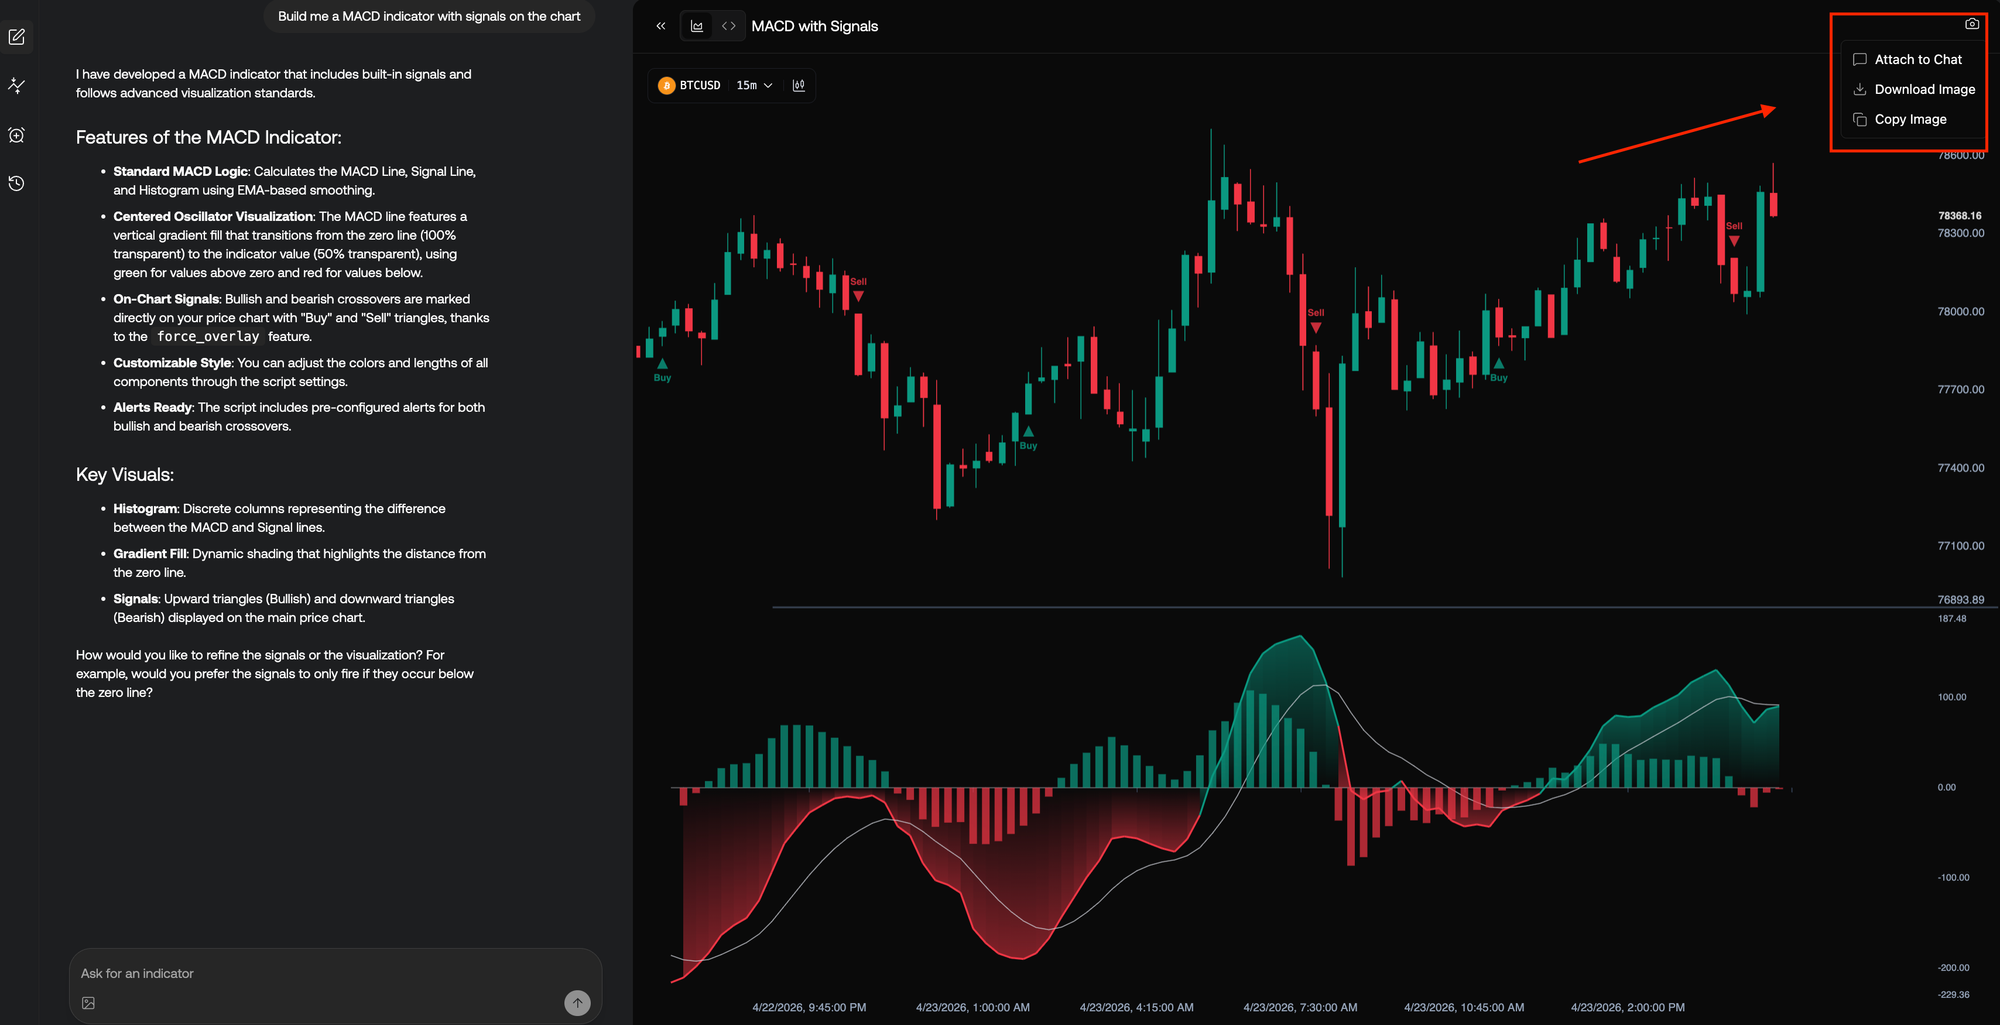
Traders can now send chart snapshots to the Quant editor in one click, giving the AI more context about what needs to be adjusted, rebuilt, or refined.
This is important because trading ideas are often easier to explain visually than verbally.
A trader might want a label moved, a zone widened, a signal filtered, or a plot styled differently. They might notice that a condition triggers too early, that a level is drawn from the wrong swing point, or that an overlay needs to be cleaner in high-volatility conditions.
Explaining those details through text alone can be difficult. A chart snapshot gives Quant direct visual context so the next edit can be based on what is actually happening on the chart.
This strengthens the loop between visual analysis and code generation. Instead of treating chart screenshots as a separate input, Quant now makes them part of the live editing process.
For traders building custom TradingView indicators, this can make refinement much faster. You can run the script, inspect the chart, send the visual context back to Quant, and ask for a targeted adjustment without rebuilding the idea from scratch.
Unlimited Lines, Labels, Plots, and Chart Elements With No Engine Limits
Some of the most useful TradingView indicators are also the most visually complex.
They may draw support and resistance levels, highlight liquidity areas, track structure shifts, plot multiple confirmation signals, display labels, show trend states, or combine several types of visual information into one script.
These kinds of indicators can be harder to build because visual limits often become part of the development problem. When a script uses many lines, labels, plots, or objects, the trader may need to simplify the concept before the full idea is even tested.
The new Quant update removes that restriction inside the Quant engine by supporting unlimited lines, labels, plots, and chart elements with no engine limits.
This gives traders more freedom when prototyping visual indicators. Instead of designing around engine constraints too early, they can focus on whether the idea itself is useful.
For example, a trader could explore more advanced visual systems such as multi-level structure maps, dense signal labeling, dynamic range zones, or custom dashboards without immediately cutting the concept down to fit a limited preview environment.
That freedom is especially valuable during early-stage development. Many indicator ideas need to be seen in full before they can be simplified, optimized, or made production-ready.
Why This Update Matters for AI Pine Script Development
The first version of Quant focused on solving the core problem with AI-generated Pine Script: reliability.
Generic AI tools can produce Pine Script that looks convincing, but traders often still need to validate syntax, correct logic, and check whether the output behaves properly. Quant was built as a specialized AI coding agent for TradingView indicator and strategy creation, with Pine Script validation and debugging built into the workflow.
This update expands that idea from code reliability into visual workflow reliability.
The problem is no longer just “can AI generate Pine Script?” The better question is “can AI help traders build, run, inspect, and refine TradingView scripts without breaking their creative flow?”
With integrated charts, direct script execution, chart snapshots, 6,000+ asset testing, and no engine limits on visual elements, Quant moves closer to that answer.
This makes Quant more practical for the actual way traders work.
Traders do not develop indicators in a straight line. They experiment. They compare. They notice details. They adjust plots. They test different symbols. They ask for revisions after seeing how the script behaves visually. The new Quant workflow supports that process more naturally.
Traders who want additional educational context can also explore the LuxAlgo Blog, where related guides cover indicators, strategy development, backtesting, technical analysis, and practical TradingView workflows.
Who the New Quant Update Is For
This update is useful for any trader who wants to build or customize TradingView indicators with less friction.
For non-coders, the integrated chart workflow makes Pine Script development feel more visual and less technical. Instead of needing to understand every line of code, traders can describe what they want, run the result, and refine it based on what they see.
For experienced Pine Script users, the update speeds up prototyping. Traders who already understand indicator logic can use Quant to move through early ideas faster, test visual behavior sooner, and reduce the repetitive work involved in debugging and styling.
For strategy builders, the ability to test across thousands of assets makes early validation more practical. A concept can be reviewed across different market types before spending more time refining the logic.
For visual traders, chart snapshots make it easier to explain the exact changes they want. Instead of translating every adjustment into technical language, they can use the chart itself as part of the prompt.
Traders who prefer starting from ready-made indicators before building their own can also explore the free LuxAlgo Library, which includes a collection of indicators available with a free LuxAlgo account.
Overall, this update is for traders who want the AI-assisted coding process to feel closer to actual chart-based development.
Practical Ways Traders Can Use the New Quant Features
The new Quant update opens up several practical workflows for traders building custom indicators.
1. Build an Indicator and Immediately See It on a Chart
A trader can prompt Quant to create a custom trend indicator, run the script directly inside Quant, and instantly review whether the signals align with the intended market behavior.
2. Bring in an Existing Script and Improve It
A trader can input an existing Pine Script indicator into Quant, visualize it on the integrated chart, and ask Quant to help debug errors, improve the code structure, add new settings, or refine how the indicator appears visually.
3. Compare the Same Script Across Different Markets
A trader can test the same indicator idea across stocks, crypto, forex, commodities, and other markets to see whether the logic remains useful across different price structures.
4. Refine Visual Elements Faster
If labels are too crowded, lines are unclear, or plots need better styling, traders can use the integrated chart and snapshot workflow to show Quant what needs to change.
5. Prototype More Complex Visual Systems
With no engine limits on lines, labels, plots, and chart elements, traders can explore more advanced visual concepts before simplifying the final version.
6. Shorten the Path From Idea to Deployable Script
The entire workflow is designed to reduce the number of steps between having an idea and seeing that idea operate on a chart.
For traders who want to combine custom development with broader LuxAlgo workflows, Quant can sit alongside AI Backtesting, TradingView-based indicators, and educational resources from the LuxAlgo Blog.
How to Access the New Quant Features
You can try the new Quant workflow from the LuxAlgo Quant page.
Quant is available to all users, while Premium and Ultimate users receive higher usage limits. Traders can also review the Quant documentation to understand how Quant works, what it is designed for, and how to use it for Pine Script indicator and strategy development.
Traders who want to compare usage tiers can review the LuxAlgo Pricing page, while those exploring other LuxAlgo resources can start from the main LuxAlgo website.
If you have been using Quant to generate TradingView scripts already, this update makes the workflow more complete. You can now move from idea to script to chart review without constantly leaving the editor.
Frequently Asked Questions
Can I run indicator scripts directly inside Quant?
Yes. The new Quant update lets traders run indicator scripts directly inside Quant, making it easier to test and review Pine Script output without constantly switching tabs.
Can I input my own Pine Script into Quant?
Yes. Traders can input their own Pine Script indicators into Quant, visualize them on integrated charts, test how they behave, and use Quant as a coding assistant to debug, improve, or expand the script.
Does Quant now include integrated charts?
Yes. Quant now includes fully integrated charts so traders can visualize indicator scripts directly inside the Quant workflow.
How many assets can I test with Quant?
The new update supports free testing across 6,000+ assets, giving traders more room to review how indicator ideas behave across different markets.
Can I attach images in Quant?
Yes. Traders can attach images and send chart snapshots to Quant, making it easier to give the AI visual context for edits, refinements, and improvements.
Are there limits on lines, labels, plots, or chart elements?
The new Quant engine supports unlimited lines, labels, plots, and chart elements, allowing traders to prototype more visually complex indicator ideas without engine limits.
Is Quant the same as a generic AI chatbot?
No. Quant is an AI coding agent specialized in generating and validating Pine Script indicators and strategies for TradingView. It is designed specifically for trading-tool development, not general chat-based coding.
Do I need to know Pine Script to use Quant?
No. Quant is designed to help traders create Pine Script indicators and strategies from natural language prompts. Pine Script knowledge can still help when reviewing advanced logic, but it is not required to start building.
References
LuxAlgo Resources
- LuxAlgo
- LuxAlgo Blog
- LuxAlgo Quant
- Quant Documentation
- LuxAlgo AI Backtesting Assistant
- AI Backtesting Documentation
- LuxAlgo Pricing
- LuxAlgo Library
- Code TradingView Indicators with Quant: The Best AI for Pine Script