Learn the key differences between pips and ticks in trading, how they impact Forex strategies, and their applications across various markets.
Pips and ticks are essential for measuring price changes in trading, but they serve different purposes.
- Pips are specific to the foreign exchange (forex market) and represent the smallest price movement in currency pairs (e.g., 0.0001 for most pairs or 0.01 for JPY).
- Ticks apply across multiple markets—including stocks, futures, and forex—and represent the smallest price increment for a specific instrument.
Quick Comparison
| Feature | Pips | Ticks |
|---|---|---|
| Market | Forex only | Multiple markets |
| Standardization | Fixed (e.g., 0.0001) | Varies by instrument |
| Usage | Risk management, profit/loss | Precise price tracking |
| Value | Consistent (e.g., $10/pip) | Depends on contract/market |
Key takeaway: Use pips for forex risk management and ticks for detailed price analysis in various markets. While they may sometimes coincide in value, their definitions and applications differ across asset classes.
Pips, Points, and Ticks: What's the Difference?
Understanding Pips
In forex trading, pips are used to measure price changes in currency pairs. A pip represents the smallest standard unit of price movement in an exchange rate, enabling traders to quantify and communicate changes clearly.
How Pips Work
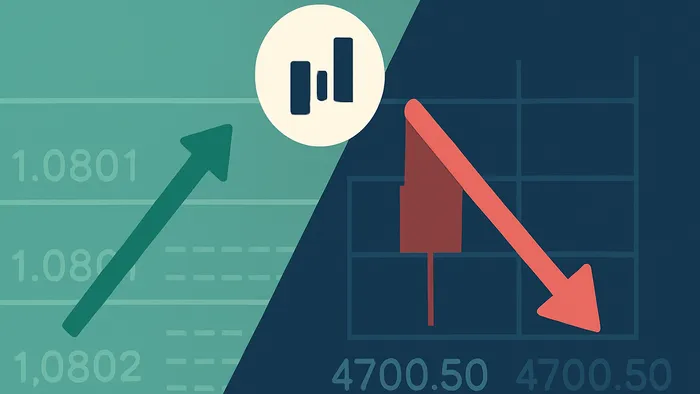
For most currency pairs, a pip is equal to 0.0001, or the fourth decimal place. However, for JPY pairs, a pip is equal to 0.01. For instance, if EUR/USD moves from 1.0801 to 1.0811, this is a 10-pip change.
The value of a pip depends on several factors:
- The specific currency pair
- The current exchange rate
- The size of your trading position
In practice, pip values help traders standardize risk. For example, a trader might risk exactly 20 pips on a trade, knowing the dollar value this represents given their position size. This standardization is crucial for disciplined risk management.
Using Pips in Trading
Calculating pip values can get tricky with certain currency pairs. For example, when trading USD/CAD, you divide the pip size by the exchange rate and multiply by lot size.
| Currency Pair | Standard Lot Size | Exchange Rate | Pip Value (USD) |
|---|---|---|---|
| EUR/USD | 100,000 | 1.0801 | $10.00 |
| USD/CAD | 100,000 | 1.2829 | $7.79 |
| EUR/JPY | 100,000 | 132.62 | $7.54 |
Understanding pip values is crucial for setting accurate stop-loss orders and estimating potential profits. Modern platforms also offer fractional “pipettes” (1/10th of a pip) for finer precision, giving scalpers and high-frequency traders greater control over execution.
Understanding Ticks
Ticks apply across various markets, representing the smallest price movement in a given instrument. Unlike pips, tick values and increments can vary dramatically between asset classes, exchanges, and even individual securities.
How Ticks Work
A tick refers to any change in price, whether up or down. Its value depends on market conventions and contract terms. For example, in futures markets, tick values are set by the exchange, while in equities they are often standardized to $0.01 increments under SEC regulations.
Ticks Across Markets
Different markets define ticks in their own increments:
| Market Type | Tick Size | Example Movement | Tick Value |
|---|---|---|---|
| Forex (EUR/USD) | 0.0001 | 1.1200 → 1.1201 | $10.00 per standard lot |
| E-mini S&P 500 Futures | 0.25 points | 4,700.00 → 4,700.25 | $12.50 per contract |
| US Stocks | $0.01 | $50.00 → $50.05 | Varies by share quantity |
Pips vs. Ticks: Main Differences
Side-by-Side Comparison
| Characteristic | Pips | Ticks |
|---|---|---|
| Primary Market | Forex only | Multiple markets (stocks, futures, forex) |
| Standardization | Fixed (0.0001 for most pairs) | Varies by instrument |
| Calculation | Usually $10 per pip per 100,000 units | Contract-specific |
| Usage | Stop-loss & take-profit levels | Price movement tracking |
| Precision | Fourth decimal place (except JPY) | Market-specific increments |
Trading Applications
Risk Management with Pips
Forex traders use pip values to size positions and place stop-losses consistently. For example, EUR/USD risk per standard lot = pips at risk × $10. This approach helps avoid emotional decision-making and keeps risk proportional to account size.
Trading Precision with Ticks
Tick data reveals micro-movements, crucial for timing entries/exits in volatile markets. High-frequency trading systems often depend on tick-by-tick data to capture small, fleeting opportunities that may not register in traditional candlestick charts.
Quick Overview of Platforms
| Platform | Features | Cost |
|---|---|---|
| TradingView | Custom alerts, Pine Script, charting tools | $29.95/mo |
| LuxAlgo Pricing | Library (free); Premium ($39.99/mo) adds Signals & Overlays Toolkit & Screener; Ultimate ($59.99/mo) unlocks AI Backtesting Assistant & dedicated Backtester | $0–$59.99/mo |
| Tickerly | Level 3 plan: 1,000 alerts/day, unlimited strategies | $29/mo |
LuxAlgo Trading Tools
References
- LuxAlgo Blog: Stop-Loss Strategies
- LuxAlgo Pricing
- LuxAlgo Homepage
- LuxAlgo Docs: Price Action Concepts Toolkit
- LuxAlgo AI Backtesting Assistant
- LuxAlgo Docs: AI Backtesting Assistant
- LuxAlgo Blog: Risk/Reward Ratio
- LuxAlgo Blog: Trading Strategy Guide
- LuxAlgo Blog: How to Read Candlestick Charts
- LuxAlgo Blog: Trading Indicators Explained
- LuxAlgo Blog: Fibonacci Retracement Trading
- LuxAlgo Blog: Support and Resistance Trading
- LuxAlgo Blog: Scalping Strategy Guide
- LuxAlgo Blog: Market Structure Trading
- LuxAlgo Blog: How to Use VWAP


