
The thrusting candlestick pattern signals market trends, offering insights into bullish reversals and bearish continuations during downtrends.
The thrusting candlestick pattern is a two-candle formation that traders use to predict market trends. It signals either a bearish continuation or a bullish reversal, depending on the context. Here's the key information at a glance:
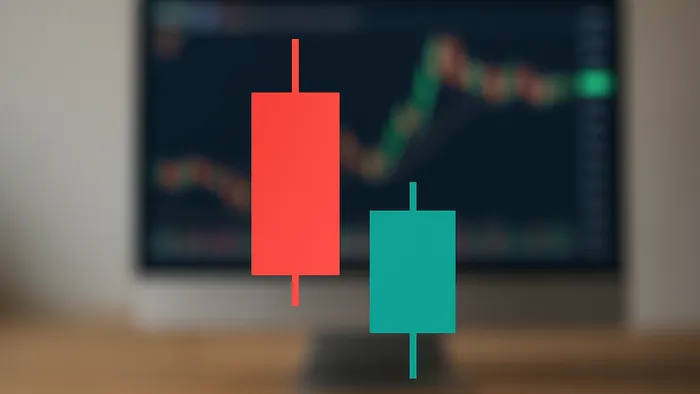
- Structure: A long red candle followed by a green candle that closes within the red candle’s body but below its midpoint.
- Performance:
- 57% bullish reversal rate (ranked 15th out of 103 patterns).
- Strongest in stocks with bullish mean-reversion strategies.
- Application: Works across stocks, forex, and crypto but performs best in downtrends.
- Confirmation Tools: Use volume analysis, trend lines, and moving averages to validate the pattern.
Quick Steps to Identify:
- Spot a downtrend.
- Look for a long red candle followed by a green candle.
- Ensure the green candle’s body enters the red candle but stays below its midpoint.
This pattern is most reliable when combined with other technical tools and proper risk management.
Pattern Structure
Core Components
The thrusting candlestick pattern consists of two candles and is used to gauge market sentiment during a downtrend. It features a long red (or black) candle followed by a green (or white) candle. The second candle opens below the first candle's close, moves upward, and closes within the body of the first candle, but remains below its midpoint.
"The thrusting part is the white candle gapping open lower but soaring into the body of the black candle. It is not a complete piercing because the candle stops below the mid point of the black body."
Key characteristics of the pattern include:
- It must form during a downtrend.
- The green candle must close within the body of the red candle but below its midpoint.
- The green candle's size should exceed 50% of the red candle's body.
Now, let’s explore how this pattern behaves in different market trends.
Upward vs Downward Patterns
The thrusting pattern adapts to market trends, showing unique features depending on whether the trend is bullish or bearish:
- In an uptrend (bullish thrusting pattern): This version acts as a continuation signal. A long green candle is followed by a shorter red candle, which closes above the midpoint of the green candle.
- In a downtrend (bearish thrusting pattern): A long red candle is followed by a green candle that enters the body of the red candle. This could indicate either a continuation or a reversal.
Similar Pattern Types
Several candlestick patterns resemble the thrusting pattern but differ in their structure and implications:
| Pattern | Key Difference | Signal Interpretation |
|---|---|---|
| Piercing Pattern | The second candle closes above the midpoint of the first candle | Indicates a bullish reversal |
| Bullish Engulfing | The second candle completely engulfs the first candle's body | Suggests a strong bullish reversal |
| Dark Cloud Cover | Opposite formation occurring in an uptrend | Signals a bearish reversal |
Bullish Thrusting Line – Candlestick Pattern Analysis
Pattern Recognition Steps
Here’s how you can identify a thrusting pattern step by step, focusing on its structure and the surrounding market conditions.
Identification Guide
To spot the two-candle thrusting pattern, look for it during a clear downtrend. It can signal either a bearish continuation or a bullish reversal. Here's how:
- Confirm the Downtrend: Make sure there’s a clear downward price movement.
- Find the First Candle: Look for a long black (or red) candlestick that extends the downtrend.
- Verify the Second Candle: Ensure the second candlestick meets these criteria:
- Opens below the previous candle's close.
- Moves more than halfway into the first candle's body.
- Closes below the midpoint of the first candle.
Common Mistakes to Avoid
Avoid these common errors when identifying thrusting patterns:
| Mistake | How to Avoid It | Why It Matters |
|---|---|---|
| Confusing It with Similar Patterns | Compare it to patterns like piercing or in-neck to ensure accuracy. | Helps you avoid false signals. |
| Ignoring the Bigger Picture | Always factor in the broader trend and volume data. | Ensures the pattern is valid within the market context. |
| Acting Without Confirmation | Wait for additional bearish candlestick patterns before trading. | Reduces the risk of entering false trades. |
Pattern Confirmation Tools
To validate the pattern, use these technical tools:
- Volume Analysis: Check for increased volume to confirm the pattern’s strength.
- Trend Line Analysis: Use trend lines to better understand the market context.
- Moving Averages: Confirm the overall trend direction.
"Always wait for confirmation before entering a trade. This can come in the form of another bearish candlestick pattern, such as a bearish engulfing or harami pattern." – TrendSpider Learning Center
For example, Meta (META) displayed a bearish thrusting pattern during a downtrend. The increased volume added confidence to the continuation signal.
Trading Methods
Trade Entry and Exit Rules
Trading thrusting patterns requires careful timing and specific market conditions. For bearish setups, enter short positions at the close of the confirmation candle if volume supports a downward trend.
For bullish reversals, which occur 57% of the time, follow these guidelines:
- Enter long positions near the opening of the green candle.
- Wait 2 – 3 periods to confirm the uptrend's strength.
- Enter on pullbacks after the price breaks above the thrusting candle's high.
Set profit targets at key resistance levels. Take partial profits at previous minor swing highs or support-turned-resistance zones. Once the first target is reached, move your stop loss to breakeven to secure gains.
Risk Control Methods
Managing risk is critical when trading thrusting patterns. Use these principles:
| Risk Component | Implementation | Rationale |
|---|---|---|
| Position Size | Risk 1 – 2% of your trading capital per trade | Protects your overall capital |
| Stop Loss Placement | Bullish trades: below the red candle's low. Bearish trades: above the pattern's high |
Sets a clear invalidation point |
| Risk-Reward Ratio | Target at least 1 : 1.5 | Ensures a favorable trade setup |
| Profit Taking | Use multiple targets at resistance levels | Balances profit-taking and risk |
Combine these risk parameters with technical tools to build a stronger trading approach.
Pattern and Tool Integration
Improve trade accuracy by pairing thrusting patterns with other technical analysis tools:
- Volume Analysis
Confirm the pattern with noticeable volume spikes. - Support and Resistance
Use significant price levels to refine entries and exits. Patterns forming near major support zones, especially within the lowest third of the yearly range, often show better reliability. - Trend Analysis
Factor in the overall market trend when analyzing thrusting patterns. In bear markets, these patterns can lead to notable moves, with average declines reaching up to 5.92% within 10 days post-breakout.
Pattern Analysis Examples
Market Examples
Meta (META) provides strong illustrations of pattern behavior. For instance, after a sharp bearish drop, a bullish thrusting pattern emerged. A long green candle retraced more than half of the previous red candle's body, hinting at a possible trend reversal.
In another scenario, META demonstrated a bearish continuation during a downtrend. Following a large red candle that extended the decline, a green candle partially retraced its body. However, sellers quickly regained control, and the downward trend continued.
In a third example, a bearish thrusting pattern created confusion during a steep downtrend. A strong green candle shifted market sentiment, triggering stop-losses and leading to an unexpected rally.
These examples are backed by data-driven backtesting metrics, reinforcing their relevance.
Testing Results
Extensive backtesting on S&P 500 (SPY) candlestick patterns from 1993 to November 2020 revealed the following performance metrics:
| Performance Metric | Result |
|---|---|
| CAGR (Top 12 Patterns) | 12.89% |
| Average Gain per Trade | 0.36% |
| Maximum Drawdown | 25% |
| Profit Factor | 2.02 |
| Market Exposure | 47% |
Specifically, for the thrusting pattern, these findings stood out:
- Success Rate: 57% accuracy for bullish reversals
- Performance Ranking: Ranked 15th out of 103 candlestick patterns analyzed
- Best Performance: Observed near yearly lows, especially within the bottom third of the price range
Professional Trading Tips
"Japanese candlestick charts offer superior clarity for fast, accurate interpretations." – Gregory Morris
- Evaluate Candle Size: Focus on taller candles for stronger signals. These typically reflect higher market conviction and clearer patterns.
- Consider Market Context: Avoid using thrusting patterns as reversal signals during major downtrends. Success rates are noticeably lower in these situations.
"However, always remember that no technical analysis tool provides a guaranteed outcome. Therefore, always use it in combination with other indicators and tools, and manage your risk effectively."
Combining pattern analysis with broader market tools and disciplined risk management is key. This method proves especially useful during volatile markets, where thrusting patterns can signal potential trend shifts or continuations early on.
Conclusion
Main Points
The thrusting candlestick pattern can be a valuable tool for traders when used with proper confirmation. With a 57% bullish reversal rate and a ranking of 15th out of 103 candlestick patterns, it offers interesting insights for technical analysis.
Here’s a quick look at its performance metrics:
| Market Condition | Metric | Result |
|---|---|---|
| Bull Market | Price Target Success | 65% |
| Bear Market | 10-Day Price Drop | 5.92% |
| Overall | Bullish Reversal Rate | 57% |
"The pattern is not a strong predictor of price direction, so it's advisable to wait for a breakout from the pattern to ascertain the likely price direction." – QuantifiedStrategies.com
Getting Started
- Look for the thrusting candlestick pattern in established downtrends, where it tends to perform better.
- Combine it with volume analysis and overall trend evaluation to increase accuracy.
- Manage your risk carefully: limit exposure to 1 – 2% per trade and set stop-losses just above the pattern's high if you're shorting.
"Effective trading relies on combining expertise, adeptness, and wise risk control measures." – QuantifiedStrategies.com


