
Learn how to analyze unusual options flow and track institutional trading to spot profitable market moves early.
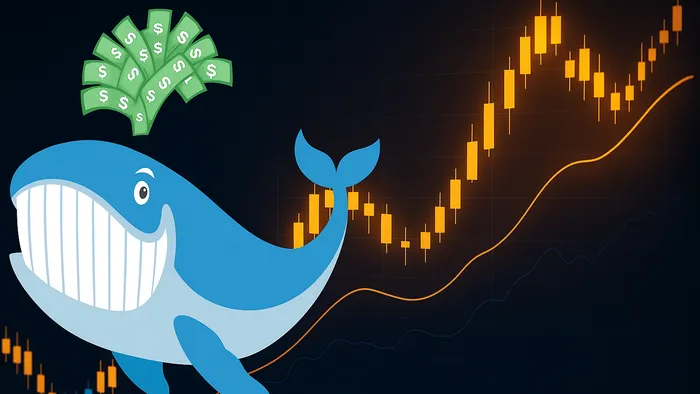
Understanding unusual options flow can help you spot big market moves early. These large trades, often made by "option whales", signal potential shifts in stock prices. Here’s what you need to know:
- Key Metrics: Look at volume vs. open interest. If volume exceeds open interest, it’s likely a new position.
- Block Trades: Large trades, especially on the ask side, suggest institutional activity.
- Real Examples: On March 15 2024, a $BSX trader made +227% gains using $67.5 call options after a strong earnings report.
- Resources to Use: Advanced filters and LuxAlgo’s toolkits and AI Backtesting platform help track and analyze these trades efficiently.
Want to follow the "whales"? Focus on volume, timing, and execution price to align your trades with institutional momentum.
Reading Options Flow Data
Volume and Open Interest
Understanding unusual options flow starts with analyzing metrics like volume and open interest, which provide insights into market activity. When volume significantly surpasses open interest, it often indicates that large traders are initiating new positions.
The connection between volume and open interest can also help determine the trade’s direction:
| Metric | Meaning | Example |
|---|---|---|
| Volume > Open Interest | Likely new position | TSLA June 21 $210 Calls: 11 698 volume vs. 9 292 open interest |
| Ask-side Execution | Signals bullish intent | BSX May 17 $67.5 Calls filled at $2.17 ask-side |
| Time Interval Volume | Shows urgency | 11 698 TSLA contracts traded within five minutes |
Block Trade Analysis
Block trades highlight institutional activity through large-scale transactions. These trades often stand out due to their size compared to typical contract volumes. Timing and execution details can provide clues about trader intent.
"Although none of these trades had a SIZE greater than OPEN INTEREST, the total volume transacted in that time interval quickly overtook the Open Interest; we can hypothesize that this is a new position due to the nature of the fills. It's not a GUARANTEE that all were opening trades, but it does seem much more likely than position closures." – Unusual Whales Team
For instance, on April 22 2024, 5 000 contracts of BSX $67.5 Calls were executed on the ask side at $2.10 per contract. This action strongly suggested institutional interest.
Options Contract Details
Details like strike price, expiration date, and premium provide further clarity on trader strategies and confidence levels.
In the Tesla trade on April 26 2024, traders chose a $210 strike price with a June 21 expiration, paying between $2.33 and $2.34 per contract. This strategy paid off as TSLA rallied, pushing contract values to $12.85 – a 451% gain.
The BSX trade shows a similar calculated approach. Selecting a $67.5 strike with a May expiration allowed time for the trade’s thesis to unfold. The contracts later reached $7.10, delivering a 227% gain.
How to Track Option Whale Trades
Setting Up Data Filters
To track large-scale option trades effectively, use specific filters to zero in on impactful moves. Here’s how to configure them:
| Filter Type | Recommended Setting | Purpose |
|---|---|---|
| Ask % | 70 % or higher | Indicates strong buying interest through ask-side execution. |
| Time Interval | 5–10 minutes | Captures real-time institutional activity. |
| Premium Value | $10 000 minimum | Screens out smaller, less influential trades. |
| Multi-leg Limit | 25 % maximum | Focuses on simpler, more transparent positions. |
After setting these filters, it’s important to evaluate whether the trades align with the broader market landscape.
Market Context Review
Understanding the bigger picture is key. External factors like earnings reports, sector-specific news, or broader market trends often validate unusual trading patterns. For example, a spike in activity might coincide with an upcoming earnings announcement or significant industry developments. Confirming this context ensures that the trades you’re tracking are meaningful and actionable.
Flow Data Visualization
Visual tools can help you spot patterns and confirm significant activity. Here are a few techniques:
- Chain Summary Analysis: Look at volume distribution over selected time frames to identify concentrated buying or selling.
- Historical Flow Review: Compare current activity with past trends to determine if trades represent new positions or adjustments to existing ones.
- Heat Map Tracking: Pay attention to areas with intense ask-side activity to locate potential opportunities.
For better accuracy, avoid including ETFs and indices in your analysis. Focusing on individual equities reduces noise and highlights actionable trades. These visual insights can help you identify the right timing and entry points, aligning your strategy with institutional momentum.
Breaking Down and Building Unusual Whales Flow Filters
Options Flow Analysis Tools
LuxAlgo’s toolkits and AI Backtesting platform make options flow analysis faster and easier, helping traders spot important market movements quickly.
LuxAlgo Toolkits for Options Analysis
LuxAlgo provides three specialized toolkits for options analysis:
| Toolkit | Purpose | Features |
|---|---|---|
| Price Action Concepts (PAC) | Analyzes market structure | • Detects patterns • Identifies order blocks • Offers detailed structure insights |
| Signals & Overlays (S&O) | Visualizes market flow | • Advanced signal algorithms • Custom overlay creation • Precision-based alerts |
| Oscillator Matrix (OSC) | Confirms trends | • Tracks divergences • Provides money flow data • Delivers trend signals |
Each toolkit includes screeners and backtesters for filtering and testing strategies. The AI Backtesting Assistant further enhances analysis by testing strategies across multiple tickers and timeframes.
LuxAlgo vs. Manual Methods
Compared to manual methods, LuxAlgo’s automated tools are faster, more accurate, and cover more assets.
| Factor | Manual Approach | LuxAlgo Solutions |
|---|---|---|
| Speed | Slow and time-intensive | Instant pattern recognition and alerts |
| Accuracy | Prone to errors and biases | Reliable, algorithm-driven insights |
| Asset Monitoring | Limited to a few assets | Monitors multiple assets simultaneously |
| Pattern Identification | Relies on expertise | Fully automated detection |
| Alerts | Basic notifications | Advanced, multi-condition alerts |
The Custom Alert Creator allows traders to set conditions based on price, volume, and options flow, cutting down on false alerts often seen with manual setups.
These resources simplify understanding options activity, making it easier to confirm trading opportunities and generate actionable signals.
Trading with Options Flow Data
Here's how you can use options flow data to make informed trading decisions, building on the insights shared earlier.
Trade Entry and Exit Points
Watching institutional options flow can help identify when to enter or exit trades. Large traders often leave clues about potential price movements.
On April 11 2024, a noteworthy trade in Apple ($AAPL) highlighted this. As the stock broke through $169, a trader purchased 1 000 contracts of the $185 Call expiring 5/3/2024 at $0.65 per contract. As $AAPL continued to climb, the trader added to the position. Around 2:30–2:35 PM, they exited when the contracts hit $1.30, locking in an 88.4 % profit.
Entry signals to watch for:
- Volume surpassing open interest
- Transactions executed on the ask side
- Multiple large orders in the same contract
Exit signals to consider:
- Significant opposing transactions
- Heavy activity on the bid side
- Volume spikes that suggest traders are exiting
Call vs. Put Analysis
Analyzing call and put activity can reveal market sentiment. Pairing this with LuxAlgo’s indicators can make the analysis even stronger.
| Flow Type | Bullish Signals | Bearish Signals |
|---|---|---|
| Volume Pattern | Heavy call buying on the ask | Heavy put buying on the ask |
| Size vs. OI | Call volume > open interest | Put volume > open interest |
| Timing | Near support levels | Near resistance levels |
| Premium Paid | Willing to pay ask price | Aggressive put buying |
Flow Alert Setup
Setting up alerts ensures you focus only on the most meaningful institutional moves. Here's how to configure them:
- Volume Thresholds
- Minimum contracts: 500
- Volume-to-open-interest ratio: greater than 1.05
- At least 65 % of total volume within the time interval
- Transaction Types
- More than 70 % of executions on the ask side
- Premium thresholds adjusted based on the stock price
- Prioritize out-of-the-money options
- Time Intervals
- Five-minute intervals for day trading
- Thirty-minute intervals for swing trading
- Custom intervals tailored to your strategy
For example, on April 26 2024, a trader using interval flow filters identified unusual activity in TSLA $210C expiring 6/21/2024. Within a five-minute window, 11 698 contracts traded compared to 9 292 open interest. Multiple ask-side orders were filled at $2.33–$2.34. By April 29, the contracts peaked at $12.85, resulting in a 451 % gain.
Summary
This section highlights the main points and examples that illustrate the value of analyzing options flow data. By tracking this data, traders can gain insight into institutional activity and uncover potential market opportunities.
Here are the primary metrics used to interpret options flow:
- Volume vs. Open Interest & Ask-Side Execution: Look at trading volume compared to existing open interest, with attention to ask-price executions to spot aggressive new positions.
- Time-Based Analysis: Keep an eye on volume clusters over short time frames to detect institutional activity.
- Position Sizing: Focus on trades where the size significantly surpasses typical daily volume.
For instance, on April 26 2024, Tesla’s options activity revealed clear institutional positioning, resulting in notable returns that supported these methods. A similar case with Boston Scientific Corporation showed how analyzing volume and execution could pinpoint profitable trades.
Success in options flow analysis relies on consistent monitoring and timely decisions. By concentrating on these metrics and practicing disciplined trade management, traders can potentially take advantage of institutional moves while keeping risks in check.
FAQs
How does the relationship between volume and open interest help identify new trading opportunities?
The relationship between volume and open interest provides valuable clues about market activity and potential trading opportunities. When volume is high but open interest remains low, it often indicates that new positions are being opened. On the other hand, if volume is high but open interest stays the same or decreases, it may signal that existing positions are being closed.
By analyzing these changes, traders can better understand market sentiment and confirm whether a position is being actively built or unwound. This insight can help you spot opportunities and align your strategy with the behavior of high-volume or institutional traders.
How can I set up effective alerts to track large institutional options trades?
To track large institutional options trades effectively, focus on identifying unusual options activity. Look for trades with high volume relative to open interest, as this often signals new positions being opened by institutional traders. Monitoring these patterns can help you spot significant market moves.
Pay close attention to volume and open interest data. A substantial difference between these numbers might indicate day trading activity or a large-scale position being established. Leveraging real-time tools to analyze this data can provide timely insights and help you act quickly on potential opportunities.
Setting up alerts for specific criteria, such as trades exceeding a certain size or unusual activity in specific sectors, can further streamline your tracking process. This ensures you stay informed about high-impact trades as they happen.
How do LuxAlgo tools simplify the analysis of unusual options flow?
LuxAlgo simplifies the process of analyzing unusual options flow by providing advanced features that save time and enhance accuracy. Instead of manually sifting through complex market data, its toolkits and AI Backtesting platform offer real-time insights and visualizations to highlight significant trades and patterns made by high-volume traders, often referred to as “option whales.”
With LuxAlgo, you can quickly identify key data points, such as unusual volume spikes or large-scale trades, and interpret them with ease. This empowers traders to make more informed decisions and spot potential opportunities in the market faster than traditional manual methods.


