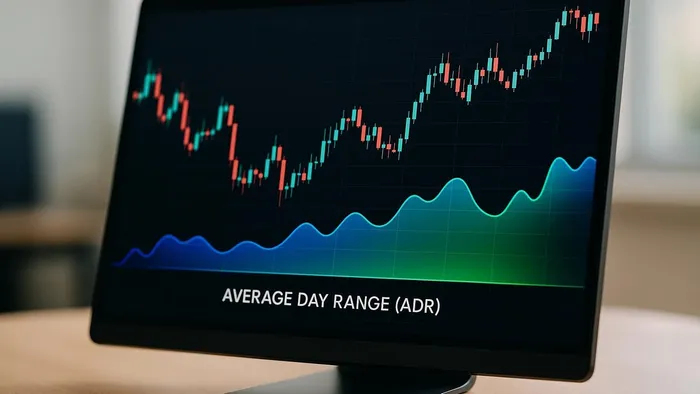

Learn how the Average Day Range (ADR) indicator enhances trading strategies by measuring daily volatility across various asset classes.
The Average Day Range (ADR) indicator measures the typical daily price movement of an asset, focusing on the high-low range rather than closing prices. It’s a simple yet effective tool to gauge volatility, set realistic profit targets, and manage stop losses. For example, if a stock has a $3 ADR, it typically moves $3 from its daily low to high.
Key features:
- Customizable Periods: Shorter periods (e.g., 5 days) reflect recent volatility, while longer ones (e.g., 20 days) provide smoother averages.
- Asset Versatility: Works across stocks, forex (in pips), cryptocurrencies, and commodities.
- TradingView Integration: Easily add ADR to charts and adjust settings for your style.
- LuxAlgo provides tools on TradingView: Enhance ADR analysis with advanced features like backtesting, alerts, and volatility zones.
ADR helps traders identify breakout opportunities, reversals, and manage risk effectively by aligning strategies with daily volatility patterns.
How the Average Day Range Indicator Works
ADR Calculation Method
The Average Day Range (ADR) calculation is simple yet effective. It measures volatility by subtracting the daily low from the high and then averaging these values over a set number of periods.
The formula looks like this: ADR = Average of (Daily High - Daily Low) over N periods
For example, if Apple's daily ranges are $3.20, $2.85, $4.10, $2.95, and $3.40, the 5-day ADR would be $3.30, representing its typical daily movement from low to high. By default, a 14-day period is often used, but this can be adjusted based on your preferences.
What makes ADR stand out is its dynamic nature. It updates in real time, reflecting current market conditions while still incorporating historical data. Unlike indicators that focus solely on closing prices, ADR captures the full picture of intraday price fluctuations.
Another key feature of ADR is its ability to contextualize volatility. For instance, a $100 stock with a $2 ADR reflects 2% daily volatility, while the same $2 ADR for a $20 stock jumps to 10% volatility. This makes it a handy tool for comparing volatility across assets with different price ranges.
ADR vs. ATR: Average True Range (ATR) also measures volatility but includes gaps and the prior close in its “true range,” whereas ADR considers only the current day’s high–low span. ATR is therefore better for comprehensive volatility baselines, while ADR excels at intraday range planning and objective daily targets. For background on ATR, see this overview from Investopedia.
Now, let’s dive into how you can customize ADR calculations on TradingView.
TradingView Customization Settings

TradingView provides flexible options to customize ADR based on your trading style. The most critical setting is the period length. Shorter periods, such as 5-10 days, react quickly to recent changes in volatility, while longer periods, like 20-50 days, offer smoother and more stable readings.
You can also personalize the visual appearance of the ADR on your charts. Traders often use bright colors like yellow or orange for clear visibility and choose between solid, dashed, or dotted lines to match their charting preferences.
Another useful feature is the display format. You can view ADR in absolute terms (e.g., $2.50 for stocks) or as a percentage of the current price. Many U.S. traders prefer absolute values for stocks and forex, while percentages are ideal for comparing assets with different price levels.
Time zone settings are also crucial. For U.S. markets, setting charts to Eastern Time ensures the ADR resets correctly with the market open. If you trade U.S. equities, aligning with the NYSE trading session hours helps avoid ADR distortions from off-hours data.
For advanced users, TradingView allows adjustments like smoothing methods and the inclusion or exclusion of extended trading sessions. These settings can be fine-tuned to align with specific trading strategies or market preferences.
With these customizations in place, let’s explore how ADR applies to different asset classes.
ADR for Different Asset Classes
ADR provides a consistent way to measure volatility across a range of markets, including stocks, forex, crypto, and commodities.
- Stocks: ADR is typically displayed in dollar amounts, making it easy to calculate position sizes and manage risk. For example, a large-cap stock like Microsoft might have an ADR of $4-6, while smaller, more volatile stocks may show ranges of $1-3, even on lower absolute prices.
- Forex: In forex trading, ADR is measured in pips, the standard unit for currency pair movements. For instance, EUR/USD might average 70-90 pips daily, while more volatile pairs like GBP/JPY could range between 120-150 pips. This helps forex traders set realistic profit targets based on typical market movements. If you’re new to the term, here’s a primer on pips.
- Cryptocurrencies: The 24/7 nature of crypto trading gives ADR a unique twist. Bitcoin, for example, might have a daily range of $800-1,500 under normal conditions, but during periods of heightened volatility, it could spike to $3,000 or more. Unlike traditional markets, crypto ADR provides continuous readings, reflecting its non-stop trading environment.
- Commodities: ADR for commodities like crude oil or gold often aligns with economic events or seasonal trends. For example, crude oil might have an ADR of $1.50-2.50 per barrel during calm periods, but this can expand to $4-6 during geopolitical events or major economic announcements.
The key advantage of ADR across all these asset classes is its ability to standardize volatility measurements. Whether you're comparing a $300 stock to a $30 stock, or analyzing EUR/USD versus Bitcoin, ADR offers a consistent framework for evaluating and comparing market volatility.
Setting Up and Customizing ADR on TradingView

Adding ADR to Your Chart
Getting ADR onto your TradingView chart is straightforward. Start by opening the chart for the asset you want to analyze. Then, click on the Indicators button (the beaker-shaped icon) to access the indicator library. In the search bar, type “Average Day Range” or “ADR” to find the built-in indicator. Make sure your chart is set to Eastern Time if you’re a U.S.-based trader, especially if you trade during pre-market or after-hours sessions, as this ensures the ADR resets correctly with market hours. After adding it, tweak the settings to match your trading preferences.
Adjusting Settings for Your Trading Style
One of the reasons ADR is so useful is its adaptability to different trading styles. The key setting to focus on is the period length, which determines how many days of data are used to calculate the average range. By default, this is set to 14 days. However, you can modify it based on your needs. For example:
- Day traders: A shorter period, like 5 to 10 days, can help reflect recent market volatility more accurately.
- Swing traders: Longer periods, such as 20 to 50 days, provide smoother, more stable readings by filtering out short-term fluctuations.
You can also customize the visual aspects of ADR to make it easier to interpret on your chart. Many traders prefer displaying ADR as an absolute value (dollars for stocks, pips for forex), but a percentage-based view can be handy if you’re comparing assets with varying price levels. Advanced settings let you choose a smoothing method—such as RMA, SMA, EMA, or WMA—and define fractional levels (like 25%, 50%, 75%, and 100% of the daily range). These fractional levels often act as intraday support and resistance zones, giving you an extra layer of insight. Once you’ve adjusted these settings, you can explore how LuxAlgo complements ADR analysis.
Using LuxAlgo with ADR

LuxAlgo provides exclusive tools that can take your ADR analysis to the next level by helping you uncover trading opportunities and refine your risk management strategy. For example, the PAC toolkit highlights key volatility zones that align with ADR levels, while the S&O toolkit provides signal algorithms filtered by ADR zones to identify potential breakout setups during periods of low volatility.
With LuxAlgo’s screeners, you can quickly filter assets based on how their current volatility compares to historical ADR levels. This allows you to spot promising opportunities across various markets without wasting time. Additionally, the AI Backtesting Assistant lets you test strategies that incorporate ADR-based rules. For instance, you could set up a strategy where trades are entered when the price hits 25% of the ADR and profits are taken at 75%.
LuxAlgo also enhances risk management by working seamlessly with ADR insights. Use the Custom Alert Creator to set alerts for when assets approach critical ADR levels, ensuring you never miss a potential setup during active trading hours. For deeper strategy ideas, see new AI backtesting features and the strategy fetching guide.
Using ADR in Trading Strategies
Setting Price Targets and Stop Losses
ADR (Average Daily Range) can be a game-changer for managing risk in trading. It gives you a clear picture of how much an asset typically moves in a day, helping you set stop losses and profit targets with greater precision. For example, if a stock has an ADR of $2.50, you can use this data to avoid placing stops too close or setting targets that are overly cautious.
When setting stop losses, consider placing them just beyond the ADR range to account for normal market fluctuations. Let’s say you’re going long on a stock with a $3.00 ADR and enter at the day’s low. If you place your stop loss $1.50 below your entry (half the ADR), there’s a good chance normal price movement could trigger it. Instead, you might aim for a stop slightly beyond the full ADR, or wait for an entry point that aligns with your risk management rules.
Profit targets follow a similar logic but in reverse. For instance, if you enter a trade when an asset has only moved 25% of its ADR, there's a reasonable chance it could still reach 75% to 100% of its range by the end of the day. For swing trades, you can project moves over several days by stacking multiple ADR levels. Just remember, ADR reflects daily ranges, so longer-term projections require additional context.
Finding Trading Opportunities with ADR Zones
Beyond managing risk, ADR also highlights key market zones that can signal trading opportunities. For instance, when an asset hits 80% to 90% of its ADR early in the day, it often suggests a potential reversal or a period of consolidation. On the flip side, if price action stays within 20% to 30% of the ADR during active trading hours, it may be a precursor to a breakout.
Morning breakout strategies pair well with ADR analysis. Assets that gap up or down at market open and quickly move beyond their typical ADR often continue trending in that direction. However, not all breakouts are reliable—some fizzle out when early volatility exhausts the day’s expected range. To filter these setups, compare current price action to recent ADR trends. If a stock regularly exceeds its ADR, the breakout is more likely to sustain momentum.
Mean reversion setups are another opportunity. When assets move to extreme ADR levels without a strong fundamental reason, they often retrace toward the midpoint of their daily range. For instance, a stock that surges to 150% of its ADR on low volume frequently pulls back later in the session. These setups are particularly effective in the last two hours of trading, when institutional activity picks up, and prices tend to stabilize.
For range-bound markets, ADR zones create predictable swing opportunities. Stocks that consistently respect their ADR boundaries allow traders to buy near the lower range and sell near the upper range, especially when there’s no clear directional trend.
Automating ADR Strategies with LuxAlgo
LuxAlgo provides exclusive tools to automate and refine ADR-based strategies, making them easier to execute. With the AI Backtesting Assistant, you can test strategies using historical data and optimize parameters like entry and exit points. For example, you could backtest a setup that buys when a stock hits 25% of its ADR and sells at 75%, then analyze how it performs across different time frames and asset classes.
The platform’s screeners simplify the process by identifying stocks trading near critical ADR levels. Instead of manually scanning charts, you can filter for assets near their ADR extremes or those with unusually low volatility that might signal a breakout. This saves time and ensures you don’t miss key opportunities during busy trading sessions.
LuxAlgo’s Custom Alert Creator is another valuable capability. It allows you to set alerts for specific ADR thresholds, such as when a stock on your watchlist hits 20% ADR (a potential breakout) or 90% ADR (a possible reversal zone). These alerts help you stay on top of market movements without needing to constantly monitor charts. Explore concepts like Price Action Concepts for confluence, and use tools such as multi-timeframe analysis to align entries with trend context.
Additionally, the PAC toolkit enhances ADR strategies by pinpointing key volatility zones that align with institutional order blocks and market structure levels. When ADR zones overlap with areas of high supply or demand, the likelihood of significant price reactions increases. The S&O toolkit adds another layer of confirmation by using signal algorithms to identify setups based on volatility conditions, improving your trade timing and success rate. Together, these tools integrate ADR insights seamlessly into your trading strategy, giving you a more efficient and data-driven approach.
Reading ADR Data and Managing Risk
Narrow vs Wide ADR Ranges
Understanding how ADR (Average Daily Range) behaves under different conditions is key to managing risk effectively. Let’s break it down: Narrow ADR ranges often indicate periods of low volatility, market consolidation, or indecision. For example, if a stock that typically moves $4.00 daily starts averaging just $1.50, it’s a red flag for a potential breakout. These tight ranges can lead to sudden price surges when the market finally moves with momentum.
When trading during narrow ADR periods, it’s essential to adjust your position sizes to manage risk effectively. On the flip side, wide ADR ranges show heightened volatility and active market participation. If an asset’s ADR shoots above its historical average, it’s often a sign of strong directional moves or increased uncertainty.
Wide ADR conditions call for wider stop-loss levels or smaller position sizes to account for the volatility. Interestingly, these wide ranges often revert to the mean, meaning volatility tends to settle back to typical levels over time.
External factors like earnings announcements, Federal Reserve meetings, or geopolitical developments can temporarily inflate ADR ranges. During such events, ADR strategies might need tweaking, as the indicator reflects unusual, not typical, behavior. Recognizing these shifts helps you adapt your ADR settings to the unique traits of each market.
ADR Settings for Different Markets
Every market has its own quirks that influence how ADR should be interpreted. Let’s take a closer look:
- Equity markets: Standard ADR settings usually work well here, but be mindful of differences in market capitalization. Large-cap stocks like Apple or Microsoft tend to have more predictable ADR patterns, while small-cap stocks can experience sudden volatility spikes that distort ADR readings. If you need a refresher, here’s a clear explainer on market capitalization.
- Forex markets: Since forex trading spans nearly 24 hours across global sessions, ADR calculations must account for varying liquidity levels during different trading hours.
- Cryptocurrency markets: With their extreme volatility and 24/7 trading, cryptocurrencies demand extra caution when interpreting ADR data.
- Commodities: For assets like crude oil or gold, ADR settings should factor in supply and demand dynamics, seasonal trends, and geopolitical events. For instance, energy markets often see expanded ADR ranges during inventory reports or OPEC meetings, while precious metals tend to react strongly to economic uncertainty or inflation concerns.
Short vs Long Period ADR Settings
Fine-tuning the ADR period can further enhance your strategy, depending on your trading style and the market environment. Here’s a quick breakdown of how short-term and long-term ADR settings differ:
| Aspect | Short Period (5-10 days) | Long Period (20-50 days) |
|---|---|---|
| Responsiveness | Adapts quickly to recent volatility shifts | Slower to reflect current market changes |
| Market Noise | More sensitive to temporary volatility | Smooths out short-term fluctuations |
| Best For | Day trading, scalping, short-term plays | Swing trading, long-term planning |
| Risk Management | Tighter stops, frequent adjustments | Broader stops, stable position sizing |
| Market Conditions | Ideal for volatile or trending markets | Works well in stable or range-bound markets |
Short-period ADR settings are perfect for traders who need immediate feedback on market changes. For instance, if breaking news or an economic release sparks volatility, a 5-day ADR will quickly reflect the shift, helping you adjust your risk parameters. However, this responsiveness can also make short-term ADR more prone to outlier days that might not reflect sustained market behavior.
On the other hand, long-period ADR settings offer a more stable perspective. A 30-day ADR, for example, provides a reliable baseline for position sizing and helps filter out temporary spikes in volatility. This approach is particularly useful for swing traders who hold positions over several days or weeks and need consistent risk metrics.
During earnings season, shorter ADR periods are great for capturing the heightened volatility around announcement dates. Conversely, during quieter periods—like the summer months, when trading volume tends to drop—longer ADR periods offer more stable readings, unaffected by occasional low-volume days.
For a more comprehensive view, consider using multiple ADR periods simultaneously. Comparing a 10-day ADR with a 30-day ADR can help you determine whether current volatility is a temporary blip or a lasting shift. When short- and long-term ADR readings align, it usually points to stable market conditions. But significant differences between the two often signal transitional phases, where extra caution in risk management is essential.
Conclusion
Key Takeaways
By incorporating the Average Day Range (ADR) into your trading strategy, you can set more precise price targets and manage risks with greater confidence. The ADR indicator is a valuable tool for gauging daily market volatility, offering critical insights into typical price movements. This makes it especially useful for establishing realistic trading goals and crafting effective risk management plans.
TradingView’s customization options allow you to tailor ADR settings to fit your trading style and the unique characteristics of different markets. Whether you're analyzing large-cap stocks like Apple or Microsoft or navigating the unpredictable world of cryptocurrencies, ADR delivers consistent and actionable insights.
LuxAlgo’s exclusive toolkits take ADR analysis to the next level. Seamlessly integrated with TradingView, these capabilities help you create a more complete and data-driven trading strategy.
These insights equip you with the tools to sharpen your trading approach and make better-informed decisions.
Next Steps for Traders
Now that you understand the potential of ADR, consider making it a regular part of your trading routine. Start by adding the ADR indicator to your TradingView chart, adjust the settings to align with your trading style, explore LuxAlgo’s advanced features for enhanced analysis, and monitor your performance to fine-tune your strategy.
Before fully committing to ADR, test it within your trading workflow. Observe how ADR readings align with actual price movements in your preferred markets. Pay attention to how external factors, like earnings reports or Federal Reserve announcements, influence volatility and adjust your approach accordingly.
Take advantage of LuxAlgo’s active community and educational resources to deepen your understanding of ADR strategies. The platform’s strategy forum and documentation are great places to learn how other traders use volatility analysis in various market conditions and timeframes.
Keep in mind that ADR works best when combined with other technical analysis tools. Pair it with trend analysis, support and resistance levels, and volume indicators for a well-rounded approach. LuxAlgo’s integrated features make it easy to blend multiple data points, helping you build stronger, more reliable trading strategies.
Average Day Range on TradingView
FAQs
How does the Average Day Range (ADR) indicator help traders manage risk more effectively?
The Average Day Range (ADR) indicator gives traders a better handle on risk by showing the typical daily price movement of an asset. This allows traders to set stop-loss and take-profit levels that match the asset's usual volatility.
Using ADR, traders can avoid placing stop-loss orders that are too close, which could lead to getting stopped out too soon. Similarly, it prevents setting take-profit targets that are too far out of reach. By aligning trading decisions with the asset’s natural price swings, traders can minimize missed opportunities and premature exits. ADR also helps fine-tune strategies as market conditions shift, leading to smarter risk management and improved decision-making.
What are the benefits of using different time periods for ADR settings on TradingView?
Using various time periods for the Average Day Range (ADR) indicator on TradingView gives traders the ability to tailor their approach to analyzing market volatility. Shorter time frames make the ADR more sensitive to recent price changes, offering faster insights but also increasing the likelihood of false signals due to heightened responsiveness. On the flip side, longer time frames provide a steadier, more dependable view of broader market trends, although they may lag when reacting to sudden price shifts.
Adjusting the time period allows traders to align the indicator with their preferred trading style. Whether you're into quick, short-term trades or prefer a slower, long-term strategy, this customization can enhance your ability to identify entry and exit points while also aiding in managing risk effectively.
How does LuxAlgo make ADR analysis more effective for spotting trading opportunities?
LuxAlgo takes Average Daily Range (ADR) analysis to the next level with advanced capabilities that help traders pinpoint critical price movements and manage risks more efficiently. With features like oscillators, price action insights, and multi-timeframe analysis, users can easily detect when prices deviate significantly from their daily averages—often a sign of potential overbought or oversold conditions.
On top of that, LuxAlgo's AI-driven backtesting and volatility-adjusted stop-loss tools allow traders to fine-tune their strategies and make more informed decisions. These capabilities make ADR-based signals not just easier to interpret but also more dependable, especially during unpredictable market swings.
References
LuxAlgo References
- LuxAlgo — Official Site
- AI Backtesting Assistant
- AI Backtesting: Fetching Strategies (Docs)
- Take-Profit & Stop-Loss (Docs)
- Price Action Concepts (Docs)
- New AI Backtesting Features (Blog)
- AI-Driven Trading (Blog)
- DTFX Algo Zones
- Seasonality Widget
- Support & Resistance — Dynamic
- Support & Resistance Levels with Breaks
- LuxAlgo Price Action Concepts
- Multi-Timeframe Market Formation
- Statistical Trailing Stop
- Volumetric Toolkit
External Resources
- TradingView
- NYSE Market Hours
- What Are Pips?
- Average True Range (ATR)
- Federal Reserve
- OPEC
- Bitcoin (Background)


