
Learn about the Belt Hold candlestick patterns, their significance in market reversals, and how to effectively trade using these signals.
The Belt Hold pattern is a single candlestick formation used in technical analysis to anticipate potential reversals. It comes in two types:
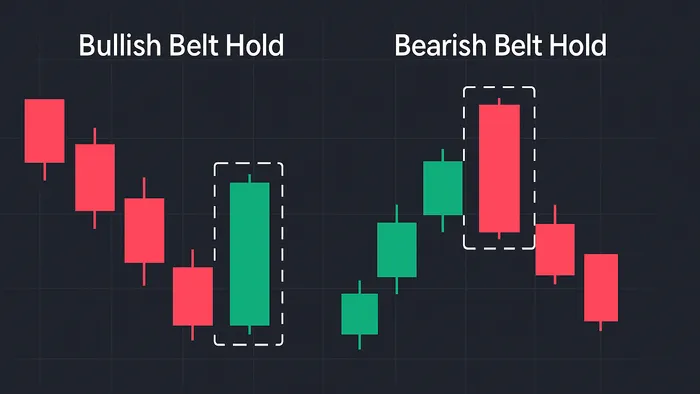
- Bullish Belt Hold: Appears in a down-trend, opens at the session’s low, and closes near its high with minimal shadows. It signals strong buying momentum and a possible trend reversal.
- Bearish Belt Hold: Forms in an up-trend, opens at the session’s high, and closes near its low with little to no shadows. It indicates strong selling pressure and a potential bearish reversal.
Key Features
- Bullish Belt Hold: Opens at the lowest price, closes near the high.
- Bearish Belt Hold: Opens at the highest price, closes near the low.
- Works best when combined with other indicators such as moving averages or RSI.
| Pattern Type | Success Rate* | Market Condition | Key Traits |
|---|---|---|---|
| Bullish Belt Hold | 71 % | Down-trend | Opens at low, no lower shadow |
| Bearish Belt Hold | 68 % | Up-trend | Opens at high, no upper shadow |
* Bulkowski (2024) sample statistics
Pro Tip: Always confirm Belt Hold signals with broader market context, key support / resistance levels, and volume-based confirmations for higher accuracy.
Bullish and Bearish Belt Hold Candlestick Patterns Explained
Types of Belt Hold Patterns
The Belt Hold pattern comes in two variations. Understanding their unique features can help traders make more informed decisions.
Bullish Belt Hold
This version surfaces in a down-trend and suggests buyers seize control right from the open.
- Opens at the day’s low, below the prior close.
- Demonstrates steady buying pressure throughout the session.
- Forms a long white / green real body with little–to-no upper shadow and no lower shadow.
Studies rank this pattern 11 th out of 103 bullish reversal signals (71 % accuracy).
Bearish Belt Hold
Appearing in an up-trend, the Bearish Belt Hold marks a potential top as sellers dominate from the opening bell.
- Opens at the day’s high, above the prior close.
- Sustained selling pressure drives prices lower into the close.
- Forms a long black / red real body with virtually no upper shadow.
This setup shows a 68 % success rate in bullish markets.
“The bearish belt hold candlestick is an opening black marubozu in an up-trend. Candle theory says it should act as a bearish reversal, and it does — 68 % of the time in a bull market.” — Tom Bulkowski
Pattern Recognition Guide
Key Pattern Features
- Long body ⇒ strong one-sided momentum.
- Bullish Belt Hold ⇒ opens at low, closes near high (white/green).
- Bearish Belt Hold ⇒ opens at high, closes near low (black/red).
Market Setup Requirements
- Bullish: Forms in a down-trend, often near support.
- Bearish: Forms in an up-trend, typically near resistance.
| Condition | Bullish Belt Hold | Bearish Belt Hold |
|---|---|---|
| Prior Trend | Down-trend | Up-trend |
| Location | Near support | Near resistance |
Similar Pattern Comparison
- Marubozu ⇒ no shadows at all, whereas Belt Hold has one small shadow.
- Engulfing ⇒ two-candle formation; Belt Hold is single-candle.
Trading Methods
Trade Entry & Exit Rules
Confirm the Belt Hold, then use breakouts for entries:
- Bullish ⇒ buy on a close above the candle’s high.
- Bearish ⇒ sell/short on a close below the candle’s low.
| Trade Component | Bullish | Bearish |
|---|---|---|
| Entry Trigger | Break above high | Break below low |
| Target | Prior resistance | Prior support |
Stop-Loss Guidelines
Set stop-loss orders a candle beyond the Belt Hold or just past the previous bar’s extreme.
Supporting Indicators
- Moving Averages ⇒ trend context.
- RSI ⇒ overbought/oversold confirmation.
- Trend Lines ⇒ confluence levels.
Example: On a Ford Motor Company 5-minute chart, a bullish Belt Hold aligned with an ascending trend line. Exiting at nearby resistance produced a clean intraday profit.
Market Examples
Stock Market Cases
In the S&P 500 over 20 years, bullish Belt Hold candles appear only 0.94 % of the time (0.60 % in the last five years). Focus on high-volume days and always add confirmation before trading the signal.
| Condition | Pattern Reliability | Best Practice |
|---|---|---|
| Strong Trend | Higher | Wait for confirmation bar |
| High Volatility | Lower | Use wider stops |
| Range-bound | Low | Pair with S/R levels |
Forex & Crypto Cases
On a GBP/USD 1-hour chart, a bullish Belt Hold within a down-trend rebounded precisely from prior support, yielding a swift move to the next resistance.
In crypto markets, volatility amplifies risk: A bearish Belt Hold on a BTC TickTrader chart required a 1 : 1.5 risk–reward to offset frequent intraday whipsaws.
Common Mistakes
- Trading Belt Holds in isolation without additional confirmation.
- Ignoring position sizing and risk-management rules.
- Misidentifying candles that do not meet Belt Hold criteria.
- Entering trades before the setup is confirmed (bull / bear traps).
| Error | Solution |
|---|---|
| Overreliance on pattern | Add multiple confirmations |
| Poor timing | Wait for close beyond trigger level |
| Neglecting stops | Pre-define exit levels |
| Mislabeling candles | Verify open & close extremes |
Summary
Key Points Review
| Pattern | Defining Traits | Typical Context |
|---|---|---|
| Bullish Belt Hold | Opens at low; long body up | Down-trend |
| Bearish Belt Hold | Opens at high; long body down | Up-trend |
Trading Best Practices
- Confirmation — act only after a close beyond the candle’s extreme and supportive volume.
- Risk Management — place stops beyond the candle and size positions responsibly.
- Confluence — blend Belt Holds with moving averages, oscillators, volume, and S/R analysis for robust signals.


