
Explore how Bollinger Bars enhance volatility analysis with fixed-width bars and dynamic visual cues, aiding traders in fast-moving markets.
The Bollinger Bars Indicator simplifies market volatility analysis by visually representing price movements directly on price bars. Created by John Bollinger, it replaces traditional candlesticks with fixed-width bars and color-coded components to highlight price direction and trading ranges. Key features include:
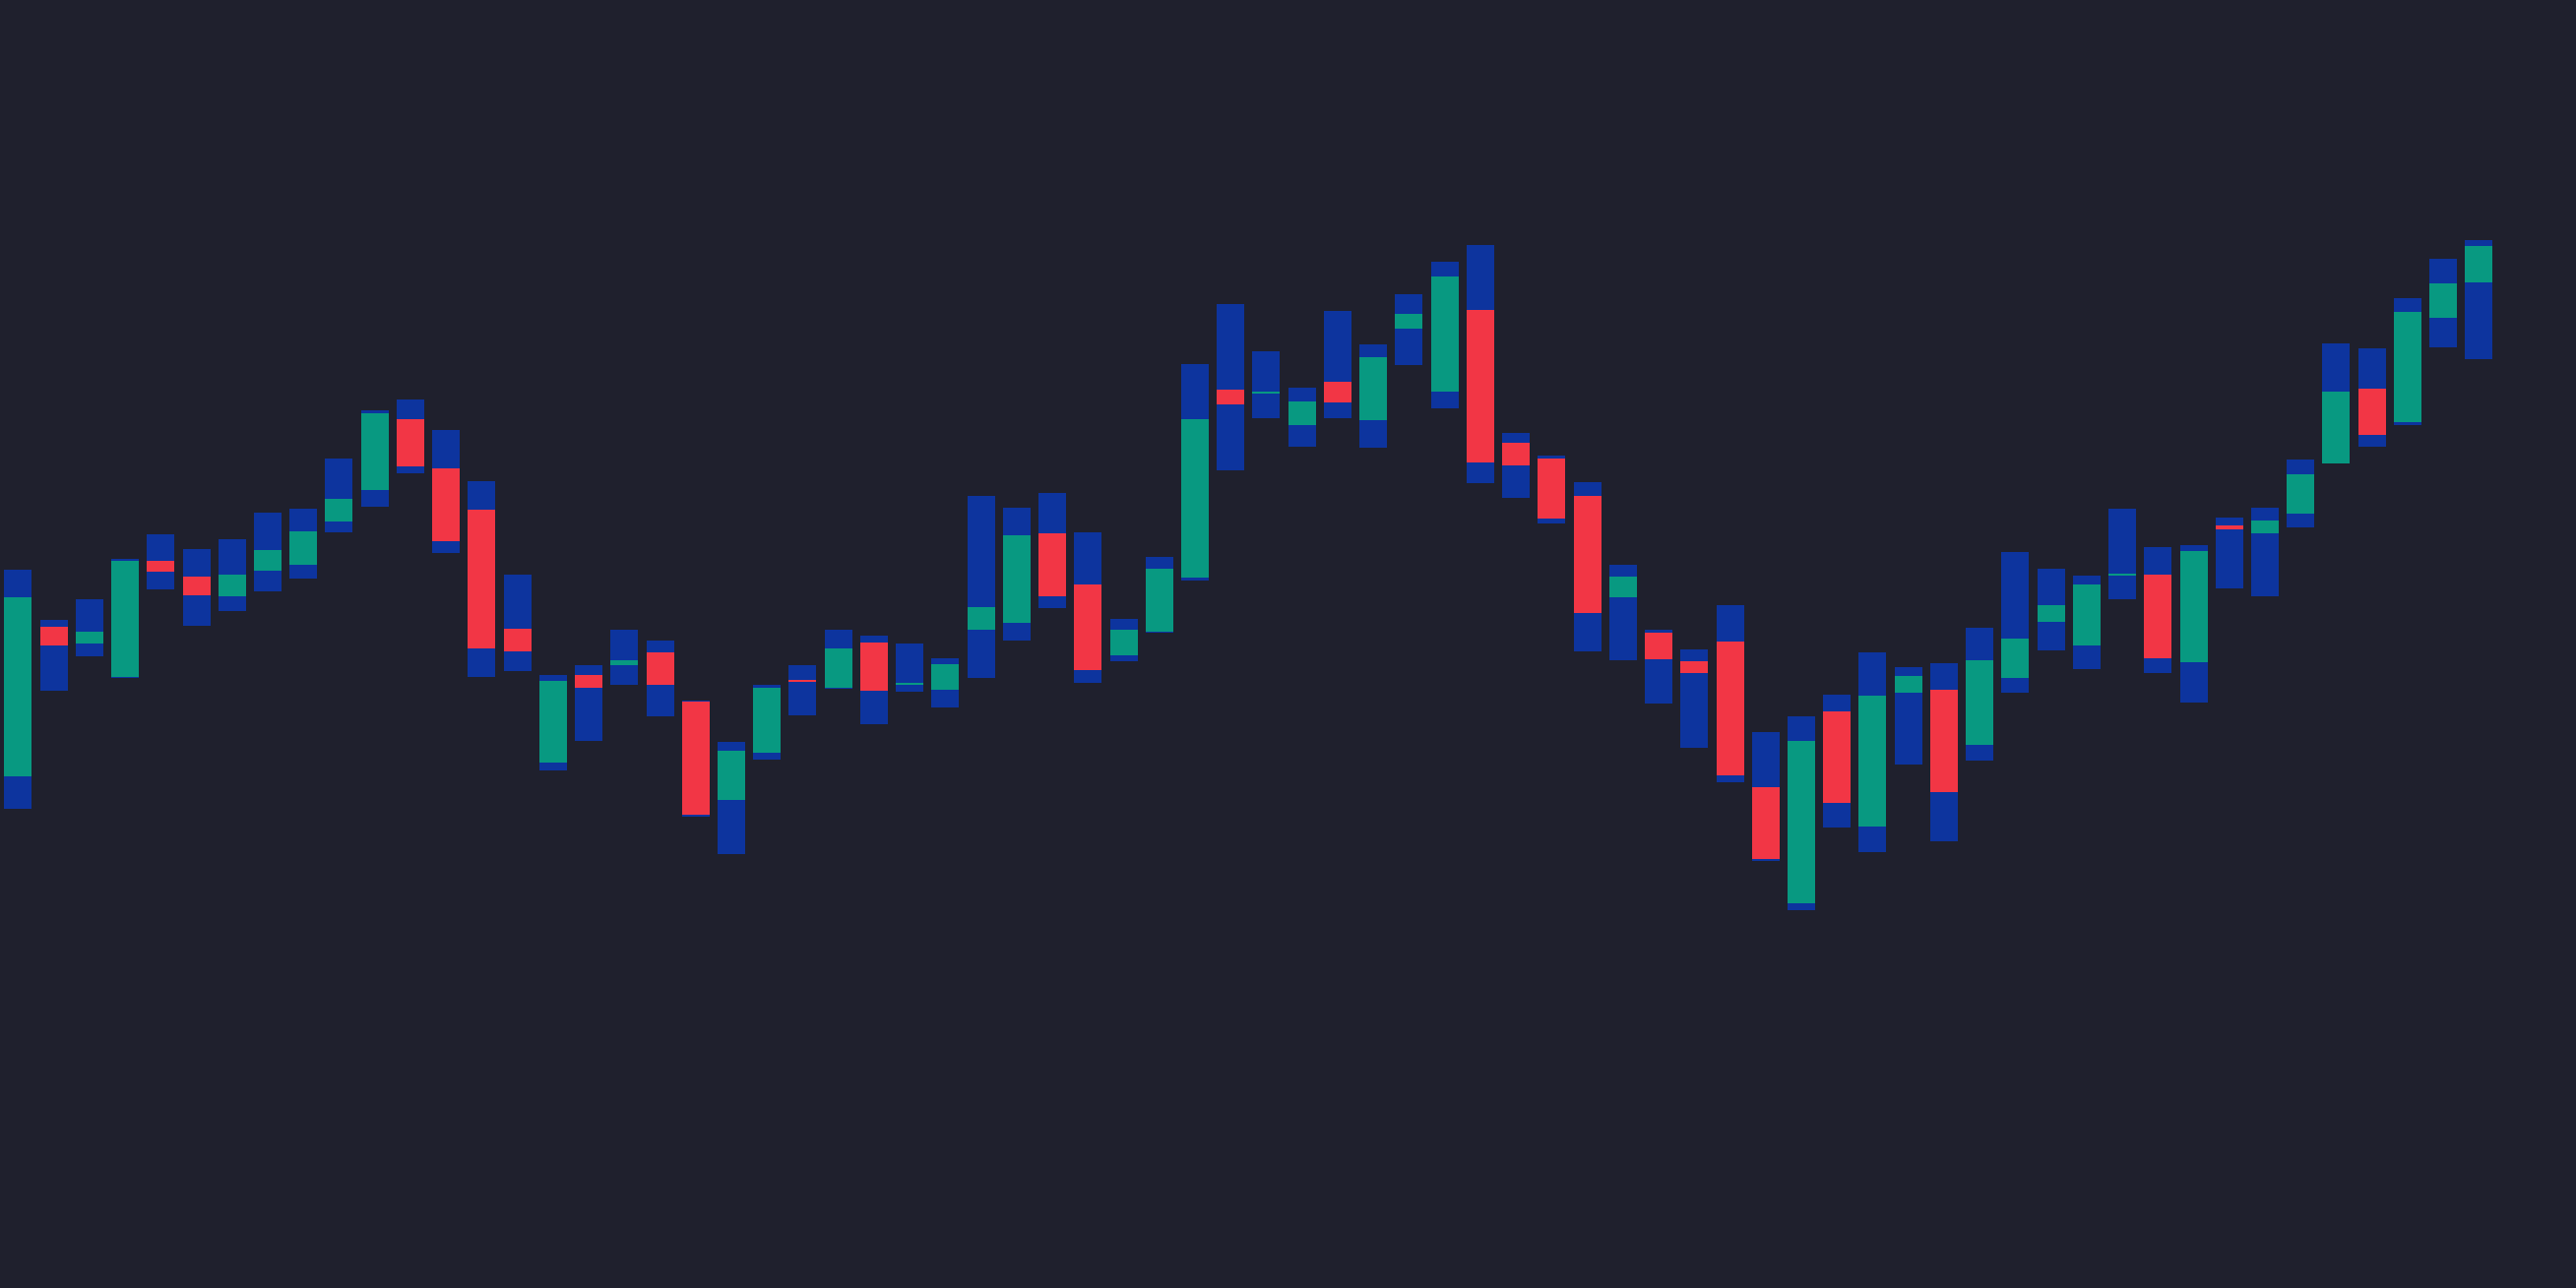
- Fixed-width candle bodies: Green for bullish closes, red for bearish.
- Wide blue blocks for wicks: Represent the full trading range, dynamically adjusting height based on volatility.
- Volatility visualization: Expanding blue blocks signal high volatility, while shrinking blocks indicate price consolidation.
Important: Bollinger Bars are independent of LuxAlgo. Traders can, however, strengthen their analysis by using LuxAlgo alongside Bollinger Bars. LuxAlgo provides additional tools—such as support/resistance features and AI Backtesting—that complement Bollinger Bars for more precise strategy development.
How Bollinger Bars Work
Main Parts of Bollinger Bars
Bollinger Bars rely on three key components to represent price action effectively. First, the candle body maintains a constant width, no matter the trading range. This creates a consistent visual appearance across all timeframes. A green body indicates a bullish close, while a red body signals a bearish close.
Next, the wide blue blocks depict the high and low wicks, extending above and below the candle body to show the full trading range. Unlike traditional candlesticks, these blue blocks have a uniform width, making it easier to spot volatility and extreme price movements. Their design ensures that traders can quickly identify spikes in market activity.
Finally, the color coding system ties everything together. The combination of green and red bodies with blue volatility blocks provides traders with an immediate sense of market sentiment and price direction.
How Bar Design Shows Volatility
Bollinger Bars are particularly effective at visualizing volatility in real-time, offering traders a clear picture of market conditions. The height of the blue blocks adjusts dynamically: during periods of low volatility, the blocks compress, signaling consolidation; during high volatility, they expand, highlighting potential breakouts.
When market volatility spikes, the blue blocks grow significantly taller, creating a striking visual cue. This happens as price ranges widen, allowing traders to instantly recognize changing conditions. The fixed-width design ensures that even subtle shifts in volatility are noticeable, as the height variations naturally draw the eye without being overshadowed by changes in the candle body size.
Bollinger Bars also excel at revealing volatility clusters, which are consecutive periods of high volatility. These clusters often occur around trend reversals or key support and resistance levels. By scanning a chart, traders can easily identify these patterns without needing to dive into detailed price range analysis. This visual simplicity makes Bollinger Bars a practical tool for market analysis.
Example: Using Bollinger Bars in U.S. Markets
For traders in the U.S., real-world examples bring these concepts to life. Take earnings season for major U.S. tech stocks as an example. When Apple (AAPL) announces quarterly earnings, its stock often sees sharp intraday volatility. On a traditional candlestick chart, this might appear as thin, easy-to-miss wicks.
With Bollinger Bars, however, the same price action is much clearer. Prominent blue blocks extend significantly above and below the candle bodies, drawing attention to the heightened volatility. For instance, if AAPL opens around $180.00, trades between $177.25 and $185.50, and closes bullishly at $183.75, the Bollinger Bar would feature a green body with large blue blocks showing the $8.25 trading range.
In the days following the earnings announcement, as volatility decreases, the blue blocks would shrink. This visually illustrates how market uncertainty peaked during the announcement and then gradually returned to normal. Similar patterns are evident in U.S. forex markets, such as when trading EUR/USD during Federal Reserve policy announcements. Bollinger Bars highlight the immediate volatility spikes following such news, making them invaluable for quick analysis.
For day traders in U.S. markets, this tool is particularly useful. Spotting volatility changes quickly can be the difference between profit and loss. With Bollinger Bars, there’s no need for complicated calculations or extra indicators - the information is right there in the bar design, ready to guide trading decisions.
Bollinger Bars vs. Bollinger Bands
Main Differences Between Bollinger Bars and Bollinger Bands
Although both Bollinger Bars and Bollinger Bands are tools designed to analyze market volatility, they approach the task in distinct ways. Knowing these differences can help traders decide which one works best for their trading style and objectives.
| Feature | Bollinger Bars | Bollinger Bands |
|---|---|---|
| Visual Display | Color-coded price bars with fixed-width blue volatility blocks | A moving average with upper and lower bands |
| Volatility Measurement | Shows volatility through the height of blue blocks | Based on standard deviation from a moving average |
| Information Focus | Highlights real-time price action and immediate volatility | Indicates price position relative to statistical ranges |
| Chart Integration | Replaces traditional candlesticks | Overlays on existing price bars |
| Time Sensitivity | Provides instant volatility feedback | Needs multiple periods to calculate bands |
| Trading Signals | Highlights volatility spikes and compressions visually | Detects band squeezes, breakouts, and mean reversion patterns |
While Bollinger Bands rely on interpreting price in relation to statistical limits, Bollinger Bars make volatility visible at a glance through variations in block height. This makes Bollinger Bars particularly useful for quick decisions in fast-moving markets.
Bollinger Bands, on the other hand, excel at identifying statistical extremes. For example, when prices touch the upper or lower band, it may signal overbought or oversold conditions. Meanwhile, Bollinger Bars focus purely on the magnitude of price movement, without regard to statistical positioning. For readers unfamiliar with the term, mean reversion describes the tendency of price to gravitate toward its average over time.
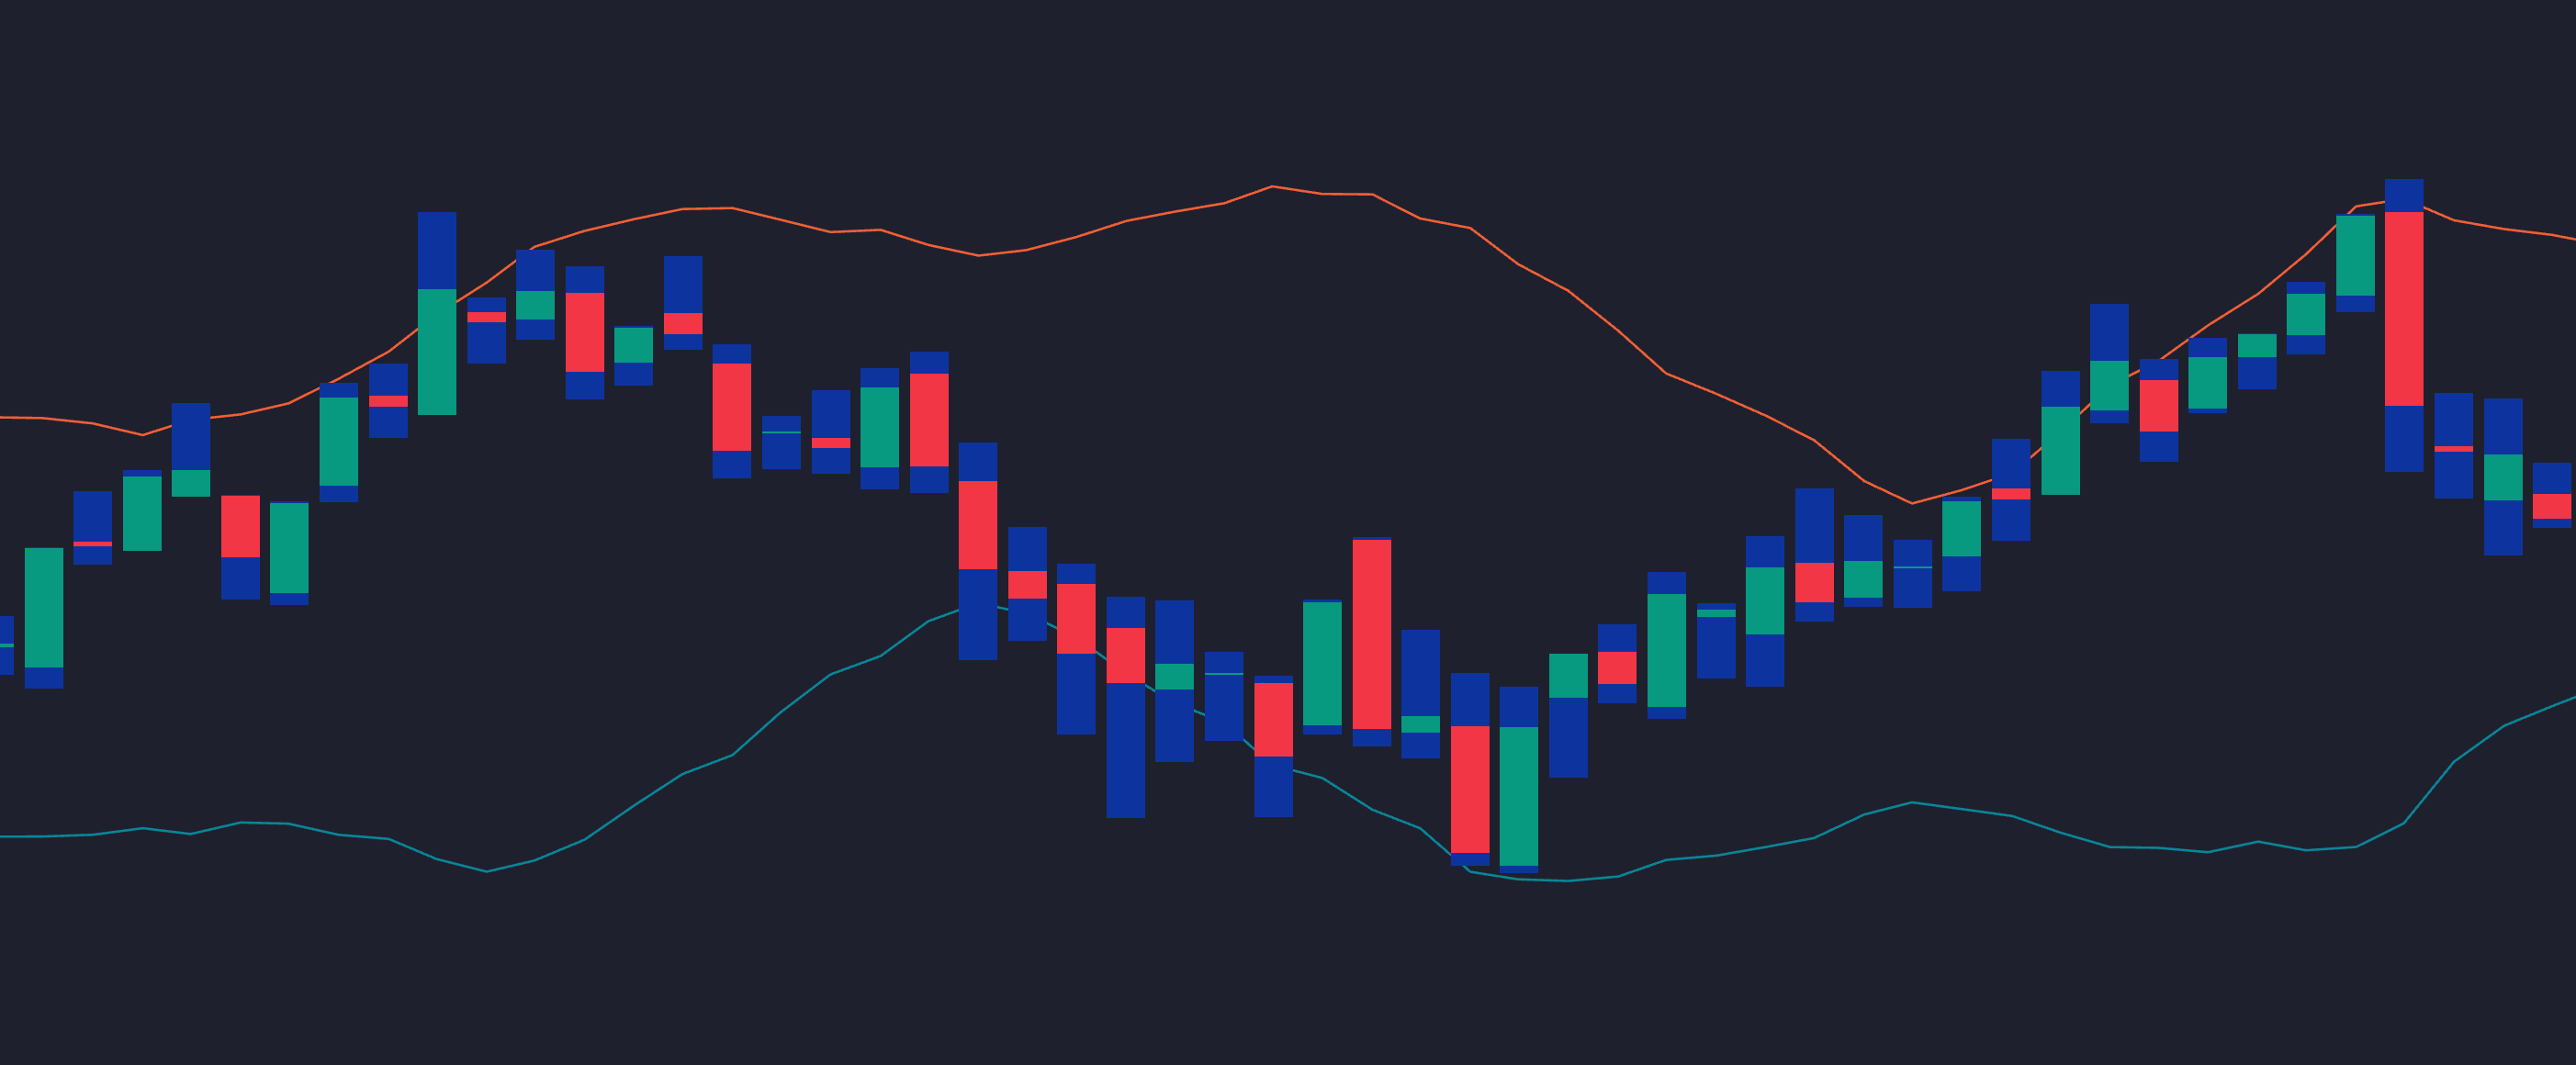
Better Volatility Analysis Using Both Tools
By combining the strengths of Bollinger Bars and Bollinger Bands, traders can gain a more complete picture of market volatility. Using both tools together adds depth to analysis, blending real-time cues with statistical insights.
Here’s how this works in practice: Bollinger Bands can highlight setups, such as a squeeze pattern where the bands contract, signaling building volatility. Bollinger Bars then confirm this setup by showing expanded blue blocks, indicating that the breakout is underway.
For instance, if price breaks above the upper Bollinger Band while Bollinger Bars show expanding blue blocks, this combination suggests a sustained trend rather than a false breakout. Conversely, mean reversion strategies benefit when price reaches extreme Bollinger Band levels, and Bollinger Bars show shrinking blue blocks, signaling fading momentum.
For traders focused on volatility, the timing precision offered by these tools is invaluable. Bollinger Bands can identify periods of unusually low volatility, while Bollinger Bars pinpoint exactly when volatility begins to surge. This can be a game-changer for options traders or anyone using strategies tied to volatility.
Real Examples for U.S. Traders
These concepts translate directly into actionable strategies for U.S. traders, as seen in several market examples.
Take Tesla (TSLA) during its volatile swings in 2023. In May, when TSLA traded near $200.00, Bollinger Bands indicated the stock was near the lower band, hinting at potential oversold conditions. At the same time, Bollinger Bars showed compressed blue blocks, reflecting low volatility. This combination suggested a setup for a rebound. When TSLA began to recover, expanding blue blocks confirmed the upward breakout, giving traders both statistical context (bands) and immediate confirmation (bars).
Forex traders also benefit from this dual approach, especially during key events like Federal Reserve announcements. Before the March 2023 FOMC meeting, EUR/USD showed tight Bollinger Bands around 1.0500, signaling low volatility. When the Fed released its rate decision, Bollinger Bars revealed massive blue blocks as the pair surged 150 pips, breaking above the upper Bollinger Band. This combination provided both directional insight and real-time confirmation.
Cryptocurrency traders can apply this strategy during Bitcoin (BTC) consolidations. For example, in August 2023, BTC hovered around $29,000 with contracted Bollinger Bands. As volatility returned, expanding blue blocks indicated the breakout direction, while band breaks provided additional context on the move.
Day traders in the S&P 500 futures (ES) market also see value in this approach. Before the market opens at 9:30 AM ET, tight Bollinger Bands in overnight futures often signal a calm before the storm. As trading begins, Bollinger Bars reveal the direction of volatility through blue block expansion, while band breakouts hint at the likely trend direction.
For U.S. traders, the key advantage lies in timing. Bollinger Bands offer a broader view of where price stands statistically, while Bollinger Bars deliver precise, real-time signals when volatility kicks in. Together, they help traders refine their entries and exits, minimizing false signals and improving overall market performance.
Trading Strategies with Bollinger Bars
Identifying Accumulation and Distribution Phases
Bollinger Bars make it easier for traders to spot critical market phases, like accumulation and distribution, by providing clear insights into volatility. For instance, during an accumulation phase, the bars often show a narrowing width even when prices seem to move sideways. This can indicate that market participants are quietly building their positions. On the other hand, when the bars widen, even with modest price movement, it may signal the start of a sell-off, which often precedes price drops.
Visual cues, such as consistent colors during low-volatility periods or rapid color changes during volatility spikes, can further validate market sentiment. This method is particularly useful for U.S. equity traders during earnings seasons, where shifts in market positioning often hint at significant price movements. Recognizing these phases helps traders prepare for potential trend reversals.
Spotting Trend Reversals and Volatility Surges
Bollinger Bars are also effective for detecting trend changes by highlighting shifts in momentum. A period of low volatility, shown by a contraction in the bars, often comes before a decisive market move. When the bars begin to expand, it can signal the start of a new trend - upward if prices break recent highs or downward if the decline continues.
These volatility signals are valuable across various markets. For example, forex traders might notice significant changes during major economic events, such as Federal Reserve rate announcements or non-farm payroll data releases. Meanwhile, U.S. equity day traders can use these signals to capture intraday movements, particularly during the market open at 9:30 AM ET. Pairing these signals with advanced trading tools can further fine-tune trading strategies.
Combining Bollinger Bars with LuxAlgo Tools
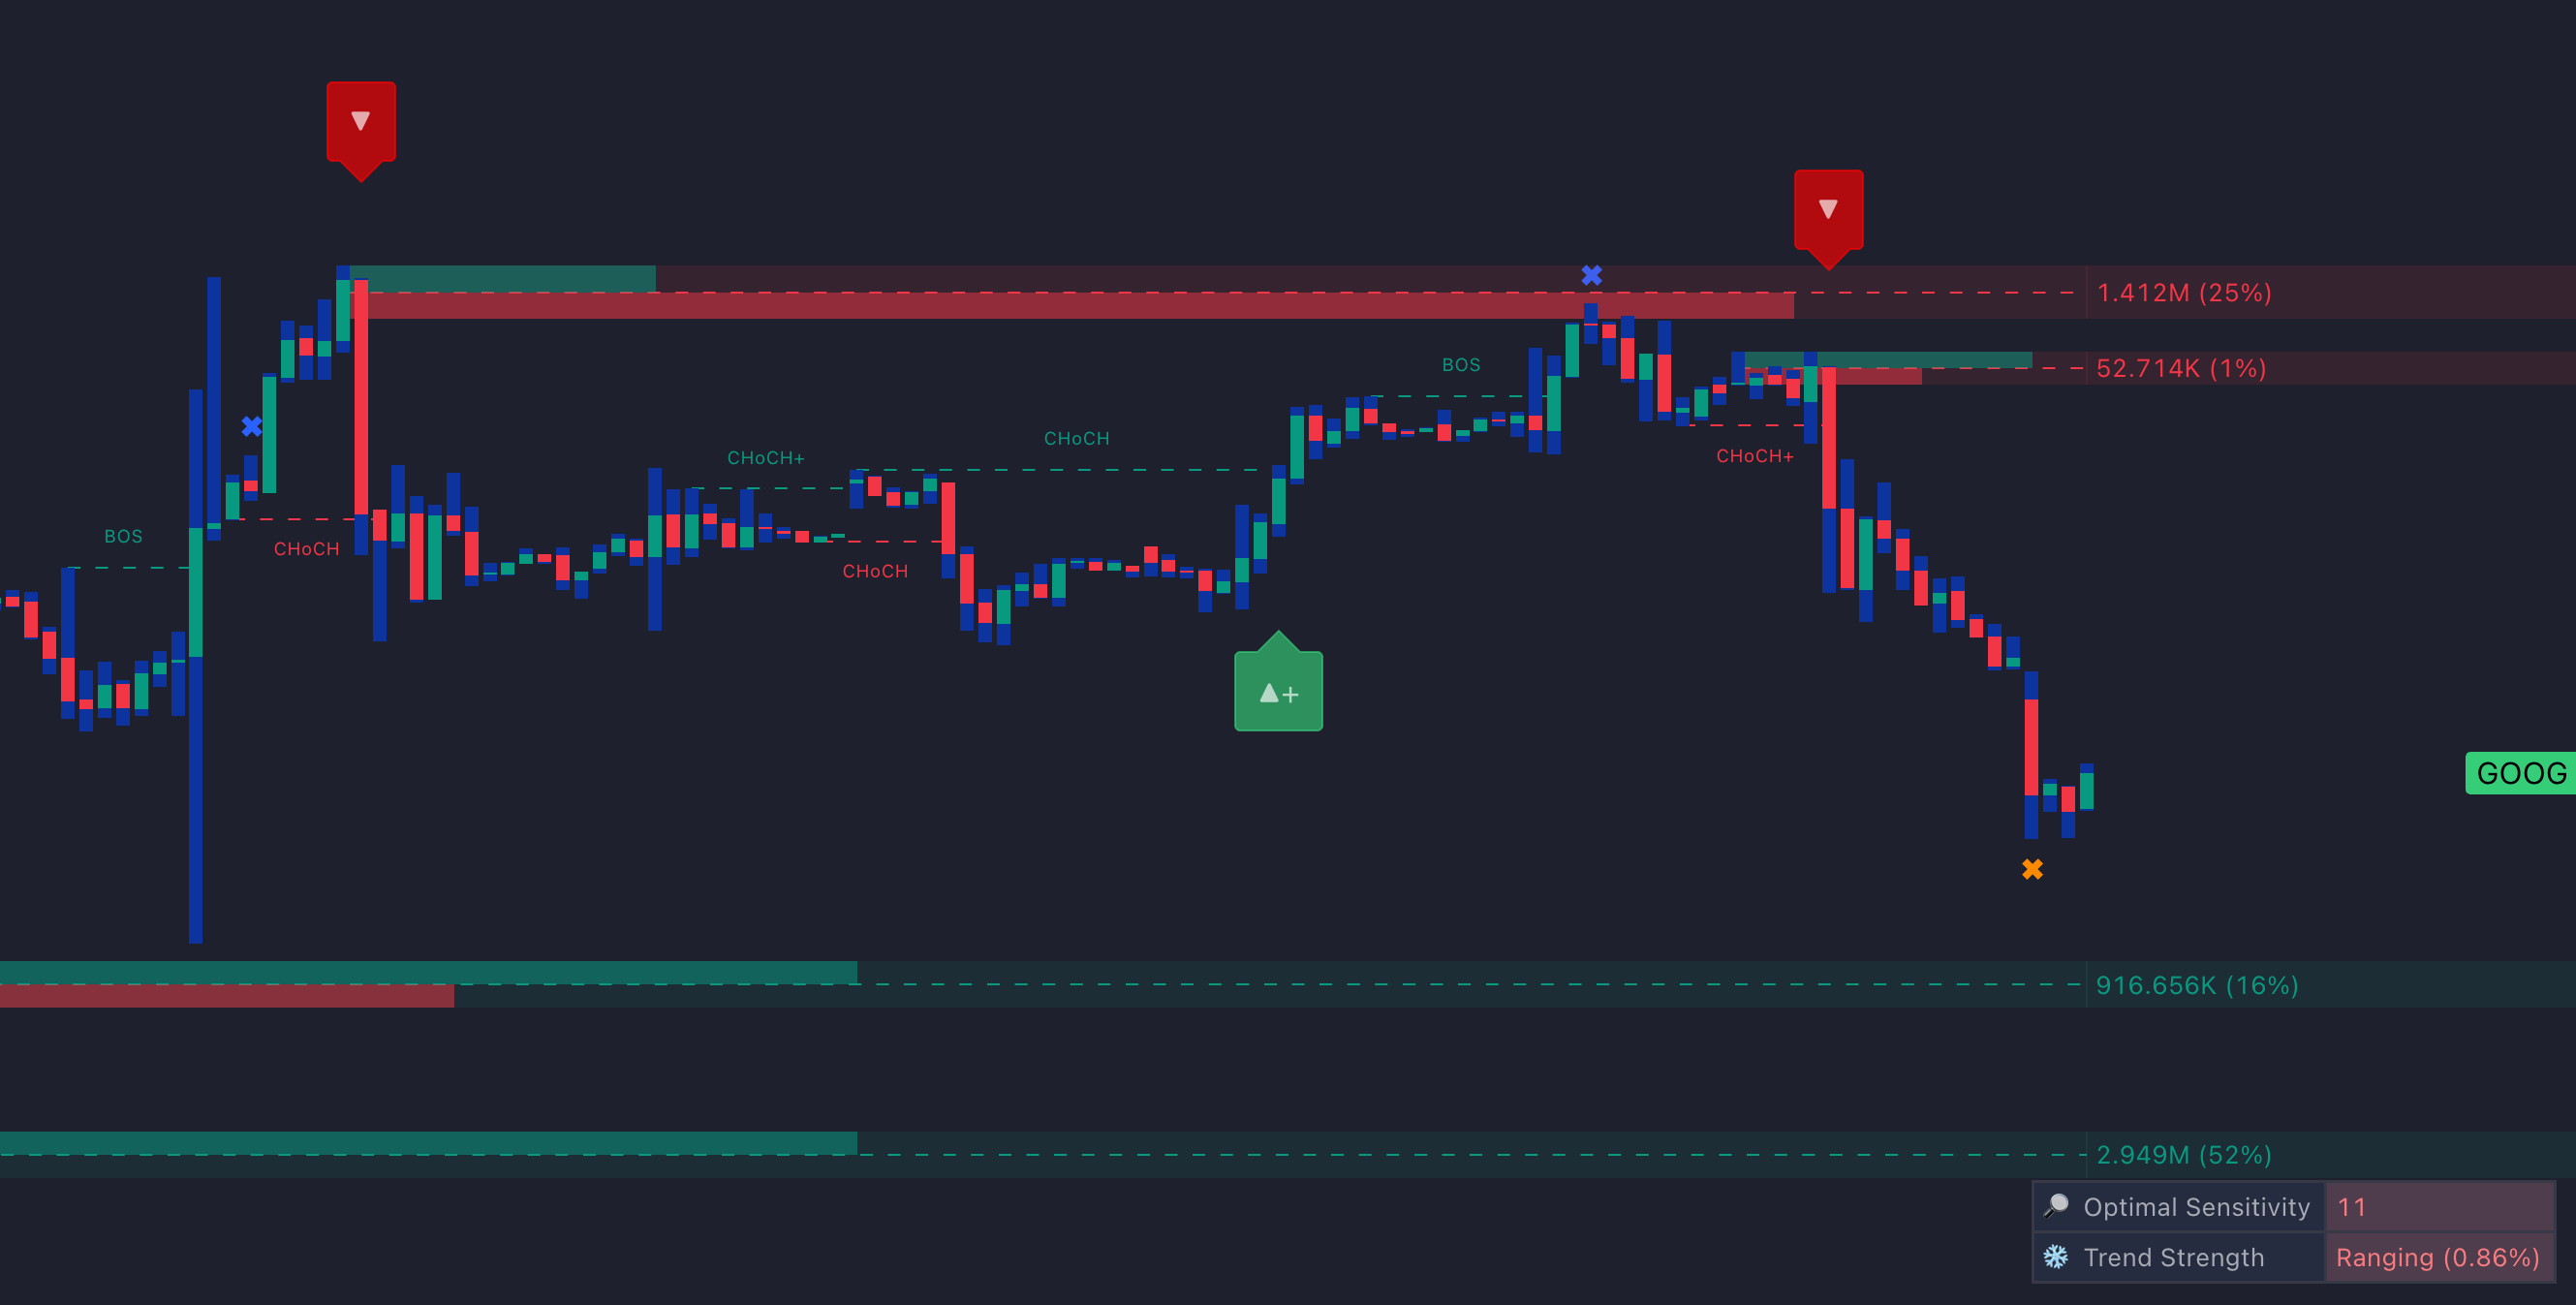
Bollinger Bars are not part of LuxAlgo, but using them alongside LuxAlgo’s tools can elevate trading strategies. For instance, the Price Action Concepts (PAC) toolkit complements Bollinger Bars. If the bars show a contraction near order blocks identified by PAC, it could indicate a high-probability trading setup.
The Signals & Overlays (S&O) toolkit adds another layer of precision. By aligning trend-following signals with the volatility insights from Bollinger Bars, traders can improve the timing of their entries. LuxAlgo’s custom alert features make this process more seamless, notifying users when specific conditions from both tools align.
Additionally, LuxAlgo’s AI Backtesting platform allows traders to test and optimize volatility-based strategies across various timeframes. Coupled with screeners that scan entire watchlists for key volatility patterns, this combination empowers traders to make more informed and efficient decisions.
Using Bollinger Bars with the LuxAlgo Platform
Getting Bollinger Bars from the LuxAlgo Library
Clarification: Bollinger Bars are not included in the LuxAlgo Library. The Library provides hundreds of other free indicators and resources. To use Bollinger Bars on TradingView, add the Bollinger Bars script available on TradingView, then use LuxAlgo’s toolkits alongside it for added context.
LuxAlgo provides a seamless experience for combining Bollinger Bars with your workflow. The LuxAlgo Library hosts other free, open-source tools, compatible with platforms like TradingView, NinjaTrader, MetaTrader, and ThinkorSwim.
To get started, search for “Bollinger Bars” on TradingView to add it to your charts. Then apply LuxAlgo’s toolkits and alerts alongside it to monitor volatility conditions and potential setups.
The free Bollinger Bars indicator (from its respective source) provides essential features for visualizing volatility. For more advanced capabilities, LuxAlgo’s exclusive tools unlock customization options and enhanced alerts to tailor your overall workflow.
Combining Bollinger Bars with LuxAlgo Toolkits
LuxAlgo's exclusive toolkits help contextualize Bollinger Bars within a broader trading framework. For example, the Price Action Concepts (PAC) toolkit identifies critical support and resistance levels using volumetric order blocks. When Bollinger Bars indicate volatility contraction near these levels, it often points to high-probability setups.
The Signals & Overlays (S&O) toolkit adds another layer of insight by offering signal algorithms that work hand-in-hand with Bollinger Bars. For instance, if expanding volatility aligns with a trend-following signal from S&O, traders can approach the trade with added confidence. The overlay visualizations make spotting these opportunities simple and efficient.
Another valuable addition is the Oscillator Matrix (OSC) toolkit, which detects divergences and money flow patterns that align with volatility shifts shown by Bollinger Bars. Together, these toolkits provide a well-rounded framework that covers price action, trend signals, and momentum analysis. Each toolkit also includes screeners to scan watchlists for specific Bollinger Bars patterns—particularly useful for U.S. equity traders monitoring stocks during regular market hours (9:30 AM to 4:00 PM ET).
LuxAlgo's AI-Powered Features for Better Results
For those looking to optimize their trading strategies, LuxAlgo’s AI Backtesting platform—available with the Ultimate subscription—can test strategies that incorporate Bollinger Bars across various timeframes and asset classes. It delivers detailed performance metrics and optimization suggestions, helping traders refine approaches for different market conditions.
The Custom Alert Creator keeps you informed by notifying you of key conditions. Whether volatility contracts or expands beyond historical norms, you’ll receive timely alerts, enabling quick responses to changing markets.
LuxAlgo also fosters a strong trading community, offering access to shared strategies, weekly scanner results highlighting promising setups, and 24/7 support. Additionally, the platform’s optimization features help keep strategies effective as conditions evolve.
Conclusion: Getting the Most from Bollinger Bars
Key Points for U.S. Traders
Bollinger Bars pack essential volatility information directly into the price bars, offering instant visual feedback on market conditions. Unlike traditional indicators that require separate panels or overlays, this tool integrates seamlessly into price action, making it easier to interpret.
One of their standout features is the ability to quickly recognize patterns. During low-volatility phases, the bars compress—often signaling potential breakouts. When momentum picks up, they expand, providing a clear visual cue. This makes Bollinger Bars especially useful for U.S. equity traders, particularly during earnings seasons when volatility can swing dramatically in a matter of hours.
They also simplify risk management. For instance, in low-volatility environments, you might consider measured position sizing, while high-volatility periods might call for tighter controls. This flexibility allows you to align your trading approach with actual market behavior. Using LuxAlgo alongside Bollinger Bars takes this a step further by enhancing practical application with alerts, screeners, and backtesting.
How LuxAlgo Makes Bollinger Bars Better
LuxAlgo builds on the strengths of Bollinger Bars by integrating tools designed to improve pattern recognition and trading precision. This combination provides a level of context that standalone indicators cannot deliver.
The AI Backtesting platform transforms Bollinger Bars from a visual aid into a strategic component when used together. By testing volatility-based strategies across market conditions, LuxAlgo helps you pinpoint when Bollinger Bars deliver the best results and how to fine-tune them for your trading style.
Another advantage is the community-driven insights. LuxAlgo’s global user network shares strategies and findings, creating a rich knowledge base that can refine your approach to volatility trading. Plus, their 24/7 support ensures you can get the most out of these tools, no matter your experience level.
What Traders Should Do Next
To fully leverage Bollinger Bars, start by integrating them into your existing trading routine. Add them to your charts and study how their volatility patterns correspond with price movements. Initially, focus on just one or two assets to get a feel for how the indicator performs across different timeframes and market scenarios.
Rather than overhauling your entire strategy, use Bollinger Bars to complement your current methods. Their volatility insights can enhance your timing for entries and exits or help you adjust position sizes more effectively. The goal is to refine, not replace, your approach.
Once you’ve mastered the basics, consider exploring LuxAlgo’s exclusive tools. The Price Action Concepts toolkit pairs well with Bollinger Bars, helping you identify high-probability setups. Meanwhile, the AI Backtesting platform allows you to validate and optimize your strategies using historical data.
Before trading live, practice with paper trading. This risk-free approach helps you understand the nuances of Bollinger Bars and builds your confidence in interpreting their signals across different market conditions.
TradingView Tips: Setting Up Bollinger Bars — NEW Collaboration with John Bollinger

FAQs
How do Bollinger Bars help traders better understand market volatility compared to traditional candlestick charts?
Bollinger Bars provide a straightforward way to visualize market volatility, displaying changes directly on the bars themselves. By adjusting their width and color based on volatility levels, these bars make spotting shifts in market conditions much simpler.
While traditional candlestick charts focus on price movement and patterns, Bollinger Bars are tailored specifically to highlight volatility. This unique approach helps traders quickly determine whether the market is in a high- or low-volatility phase, offering valuable insights for identifying trends and planning entry or exit strategies.
Can Bollinger Bars help traders navigate volatile markets like cryptocurrency and forex?
Bollinger Bars are a powerful tool for trading in fast-paced markets like cryptocurrency and forex. They offer a visual representation of market volatility, making it easier for traders to identify potential trend changes and periods of intense price movement. This is particularly helpful in markets where price behavior can be unpredictable.
By pinpointing overbought and oversold conditions, Bollinger Bars help traders make more informed decisions. They can be used to better time entry and exit points, which is crucial when navigating the rapid price swings that define these markets. Their ability to adjust to shifts in volatility provides traders with a reliable way to stay ahead in such dynamic environments.
How can combining Bollinger Bars with LuxAlgo's tools improve trading accuracy and strategy planning?
Combining Bollinger Bars with LuxAlgo's tools can significantly improve trading precision. This pairing provides traders with clear insights into market volatility and delivers reliable breakout signals, making it easier to identify the best entry and exit points. The visual clarity of Bollinger Bars, paired with LuxAlgo's advanced analytics, creates a powerful toolkit for navigating the markets.
This combination is particularly useful for adapting to various market conditions, whether the market is trending or moving sideways. Together, these tools enhance decision-making, refine trading strategies, and contribute to stronger risk management, helping traders achieve more consistent results.
References
LuxAlgo Resources
- Bollinger Bars Indicator
- Correlation Clusters
- OSC Reversal Signals
- Bollinger Bands (LuxAlgo)
- Liquidity (PAC Docs)
- LuxAlgo Homepage
- AI Backtesting
- Fetching Strategies (Docs)
- Price Action Concepts (Library)
- Market Sentiment Technicals
- Order Blocks (PAC Docs)
- Moving Average (Library)
- Weekly Stacked Daily Changes
- LuxAlgo Library (Features)
- Trend Lines


