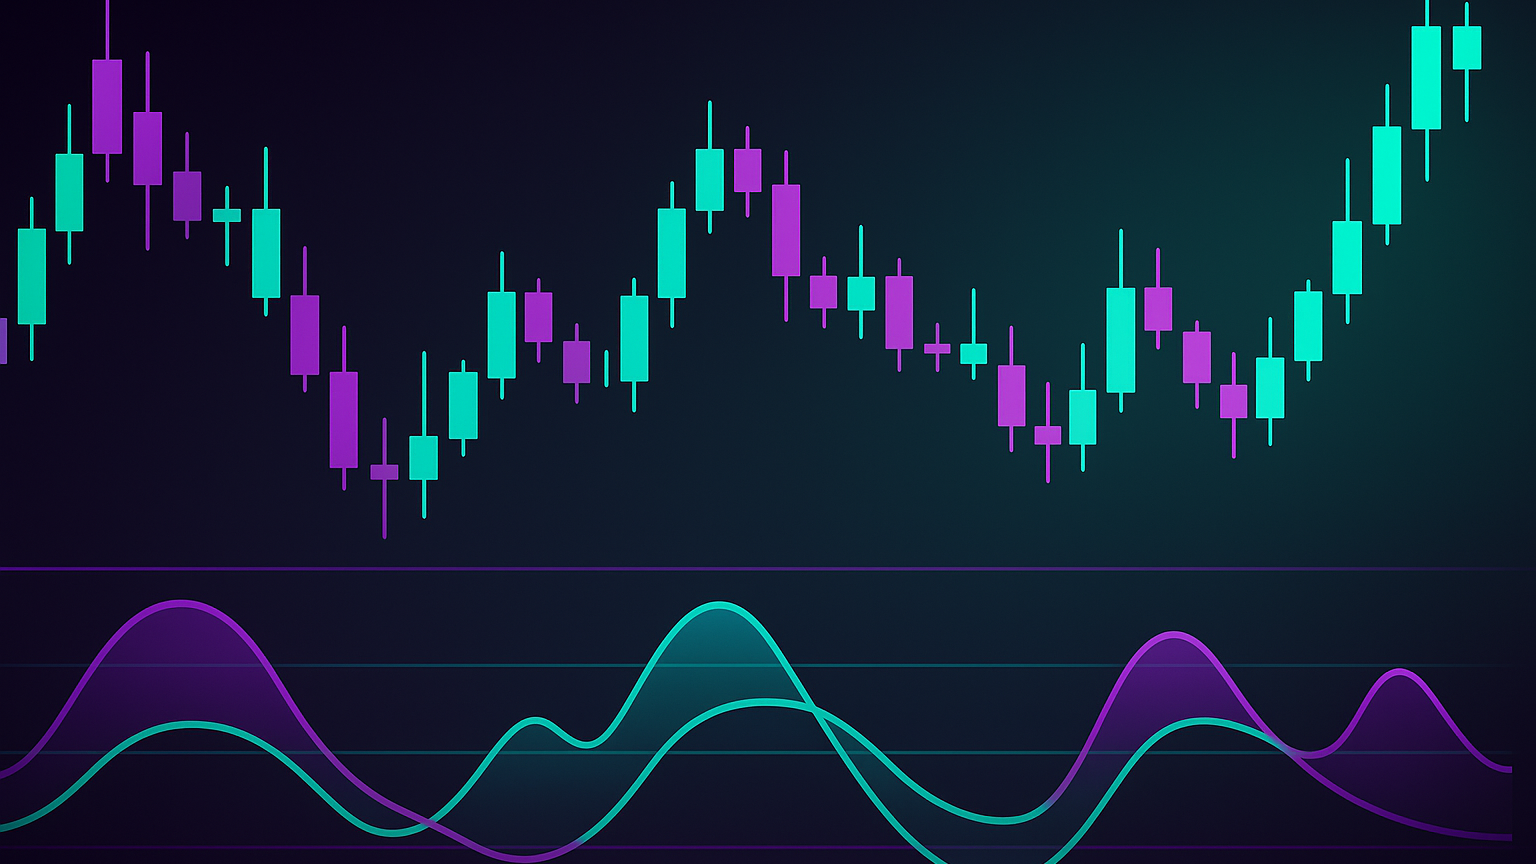
Explore broadening formations in trading: identify patterns, strategies, and risk management techniques to navigate market volatility.
Broadening formations are chart patterns that signal market volatility and potential trend changes. They form a “megaphone” shape with diverging trendlines: higher highs and lower lows. Here’s a quick summary:
-
Types:
- Broadening Top: Appears at market peaks, often bearish (60% pullback rate).
- Broadening Bottom: Found in downtrends, hints at bullish reversals (60% reversal rate).
-
Key Features:
- Diverging trendlines (one upward, one downward).
- Rising peaks, falling troughs, and increasing volume.
-
Trading Strategies:
- Breakout Trading: Enter after price breaks and retests a trendline.
- Swing Trading: Trade near Price Action Concepts toolkit’s dynamic support & resistance levels using momentum indicators. Learn more.
-
Risk Management:
- Limit risk to 2% per trade.
- Use stop-loss beyond trendlines.
Broadening formations are tricky but offer valuable insights when combined with volume analysis, RSI divergences, and multiple timeframe charts.
How to Spot Broadening Formations

Chart Pattern Basics
Broadening formations are easy to identify thanks to their distinct “megaphone” shape. This pattern features two diverging trendlines—one sloping upward and the other downward—creating an expanding, reverse-triangle price range.
“Broadening formations occur when prices move increasingly farther away from their previous highs and lows, creating two diverging trend lines—one rising and one falling.” – TrendSpider Learning Center
To pinpoint these formations, pay attention to these key visual elements:
| Visual Element | Description | Why It Matters |
|---|---|---|
| Upper Trendline | Connects higher pivot highs | Marks the upper boundary of price action |
| Lower Trendline | Connects lower pivot lows | Marks the lower boundary of price action |
| Price Range | Expands over time | Indicates growing market volatility |
This visual analysis is your first step in identifying the pattern. Next, you’ll need to confirm it by meeting specific criteria.
Pattern Requirements
Once you spot the visual cues, confirm the broadening formation by checking for these conditions:
- Rising Peaks: Each peak should be higher than the last.
- Falling Troughs: Each trough should be lower than the previous one.
- Increasing Volume: Trading activity often grows as the pattern develops.
Best Market Conditions
After confirming the pattern, evaluate the market environment to ensure it aligns with these conditions:
- High Volatility Periods: These formations often emerge during times of significant news, like policy changes or geopolitical shifts.
- Post-Movement Markets: They are most common after strong bullish or bearish moves.
- Transitional Markets: Look for these patterns during periods of uncertainty. They are less likely to appear in stable markets.
The Ultimate Guide to Broadening Formations
Trading Methods
Trading broadening formations requires a clear and disciplined approach. These strategies build on pattern identification to create actionable plans.
Breakout Trading Steps
Breakout trading in broadening formations focuses on catching price moves when the price breaks out of the pattern:
| Trading Component | Strategy Details | Risk Consideration |
|---|---|---|
| Entry Trigger | Wait for the price to break above the upper trendline (bullish) or below the lower trendline (bearish). | Confirm with higher volume. |
| Confirmation | Look for a successful retest of the broken trendline. | Avoid entering before a retest. |
| Position Sizing | Adjust position based on the pattern’s volatility. | Larger stops mean smaller position sizes. |
| Profit Target | Measure the pattern’s height and project it from the breakout point. | Adapt to market conditions. |
“Always wait for confirmation and a retest to enter a trade.”
Swing Trading Methods
Swing trading involves identifying reversals on trendlines and using momentum indicators to guide your trades. The idea is to go long near the lower trendline and short near the upper, exiting at the opposing trendline.
“A broadening formation occurs when price action creates higher highs and lower lows. It’s like the market is stretching its arms out—catch the swing at the right moment.” – StarseedFX
For instance, in the forex market, a trader spotted a broadening formation in GBP/JPY. They entered a long trade at 152.20, set a target at 154.50, and achieved a 230-pip profit in just three days.
Risk Control
Once you’ve nailed down your entry and exit strategies, risk management becomes essential:
-
Position Sizing and Stop Placement
Risk no more than 2% per trade. Adjust your position size based on a 50-pip stop loss, and place stops beyond the pattern’s trendlines while maintaining a favorable risk-reward ratio. -
Market Context Analysis
Always consider the bigger picture. Broadening formations can act unpredictably during high-volatility periods.
“Broadening formations scream one thing: uncertainty. Buyers and sellers are testing their limits before the market chooses a direction.” – StarseedFX
Technical Tools and Analysis
Volume Analysis
Volume plays a key role in confirming pattern strength. When volume increases, it often indicates strong market activity and more reliable signals.
| Volume Characteristic | Signal | Trading Implication |
|---|---|---|
| Rising Volume with Widening Price | Growing Uncertainty | Potential for larger market moves |
| Declining Volume with Widening Price | Weakening Pattern | Better to avoid trades |
| Volume Spike at Boundaries | Reversal Potential | Look for counter-trend opportunities |
Indicator Integration
Technical indicators can help confirm patterns. For example, RSI divergences have shown over 75% success when applied correctly. Here’s how traders can use them:
- Watch RSI readings outside the neutral 30–70 range.
- Identify divergences between price action and RSI movement.
- Combine MACD crossovers with RSI signals for stronger confirmation.
Tools like LuxAlgo’s Oscillator Matrix toolkit on TradingView provide real-time divergence detection and trend-following signals, helping traders analyze broadening formations more effectively.
Multiple Timeframe Analysis
Analyzing broadening formations across different timeframes helps reduce false signals. For instance, a case study from TradingwithRayner.com highlighted an NZD/USD breakout on a 4-hour chart, while the daily chart showed strong resistance.
“Multi-timeframe trading combines different trading timeframes to improve decision-making and optimize chart analysis.” – Tradeciety.com
- Begin with a higher timeframe, such as 4–6× your trading timeframe, to understand the overall trend.
- Look for alignment between timeframes.
- Focus on overlapping support & resistance levels.
- Maintain a consistent analysis routine.
Market Examples
Past Market Examples
Broadening formations often show up in volatile markets, highlighting investor uncertainty during major news events. Their widening structure reflects mixed reactions to market catalysts.
Trade Result Analysis
Successful trades depend on correct identification, timely confirmation, and strict risk control. Key factors include price breaks with rising volume, careful stop placement, and multiple timeframe confirmation.
“Broadening formations can be one of the most powerful patterns when properly identified and traded.” – TrendSpider Learning Center
Learning Points
- Pattern Recognition
Signals high volatility and potential reversals. - Volume Analysis
Look for volume spikes to confirm breakouts. - Risk Management
Strict controls are essential due to unpredictability.
Conclusion
Summary
Broadening formations indicate increased market volatility and uncertainty. These patterns, marked by diverging trendlines, can present opportunities when combined with volume, momentum, and timeframe analysis.
Getting Started
Practice identifying broadening formations on daily or weekly charts. Use breakout and swing trading approaches, confirm with volume and momentum, and manage risk with disciplined stops and position sizing.


