Supply & Demand Zones: Core Trading Strategies
Supply and demand zones are price areas that traders mark as candidates for a future reaction. A demand zone is associated with a previous upward departure; a supply zone with a downward departure. The zone is a trading hypothesis, not proof that institutions still have orders waiting there.
Use the area to organize an entry rule, an invalidation level, and a risk budget. LuxAlgo’s charting and AI platform can help make that process explicit: mark the setup in Quant Charts, inspect a relevant Library indicator, and use Quant, our coding agent, to develop testable logic. Neither a colored box nor an indicator signal guarantees a reversal.
Quick Overview
- Identify: define the base and the move away from it using rules that were available at the time.
- Plan: choose whether you are researching a bounce, a breakout, or a reversal after a failed break.
- Measure: distinguish price behavior, traded volume, and displayed liquidity instead of treating them as the same evidence.
- Control risk: set invalidation first, then size the position for its distance and execution costs.
Finding Supply and Demand Zones
Supply/demand terminology overlaps with support and resistance. Both can describe a price range rather than a single line, and either can fail. StockCharts’ support and resistance guide discusses zones and the possibility of a broken level changing roles. Calling an area “demand” does not make it more dependable than a support zone.
3 Steps to Spot Zones
- Define the base. Identify a bounded group of candles before a departure. Decide whether the boundaries use full highs/lows or candle bodies, and apply that convention consistently.
- Define the departure. A Rally-Base-Rally (RBR) is a continuation-style demand candidate, while Drop-Base-Drop (DBD) is a supply candidate. Drop-Base-Rally and Rally-Base-Drop describe reversal-style candidates. Specify what qualifies as a rally or drop instead of choosing only attractive examples afterward.
- Record when the zone became known. If the rule needs a completed departure candle or confirmed swing, the zone is only available after that event. Evaluate later returns to the zone, not trades that would have occurred before it was identifiable.
Keep the zone’s bounds, creation time, timeframe, and invalidation condition in the record. Repeated visits provide observations, but they do not automatically strengthen an area. Compare first and later tests separately; do not count every touch as confirmation while ignoring breaks.
Tools for Zone Analysis
The Supply and Demand Anchored indicator estimates areas from volume within a selected start and end point. Its threshold controls the volume share used to establish the areas, resolution controls the bin count, and the intra-bar timeframe affects the data used. Moving an anchor recalculates the result. This is different from manually identifying a candle base or reading an order book.
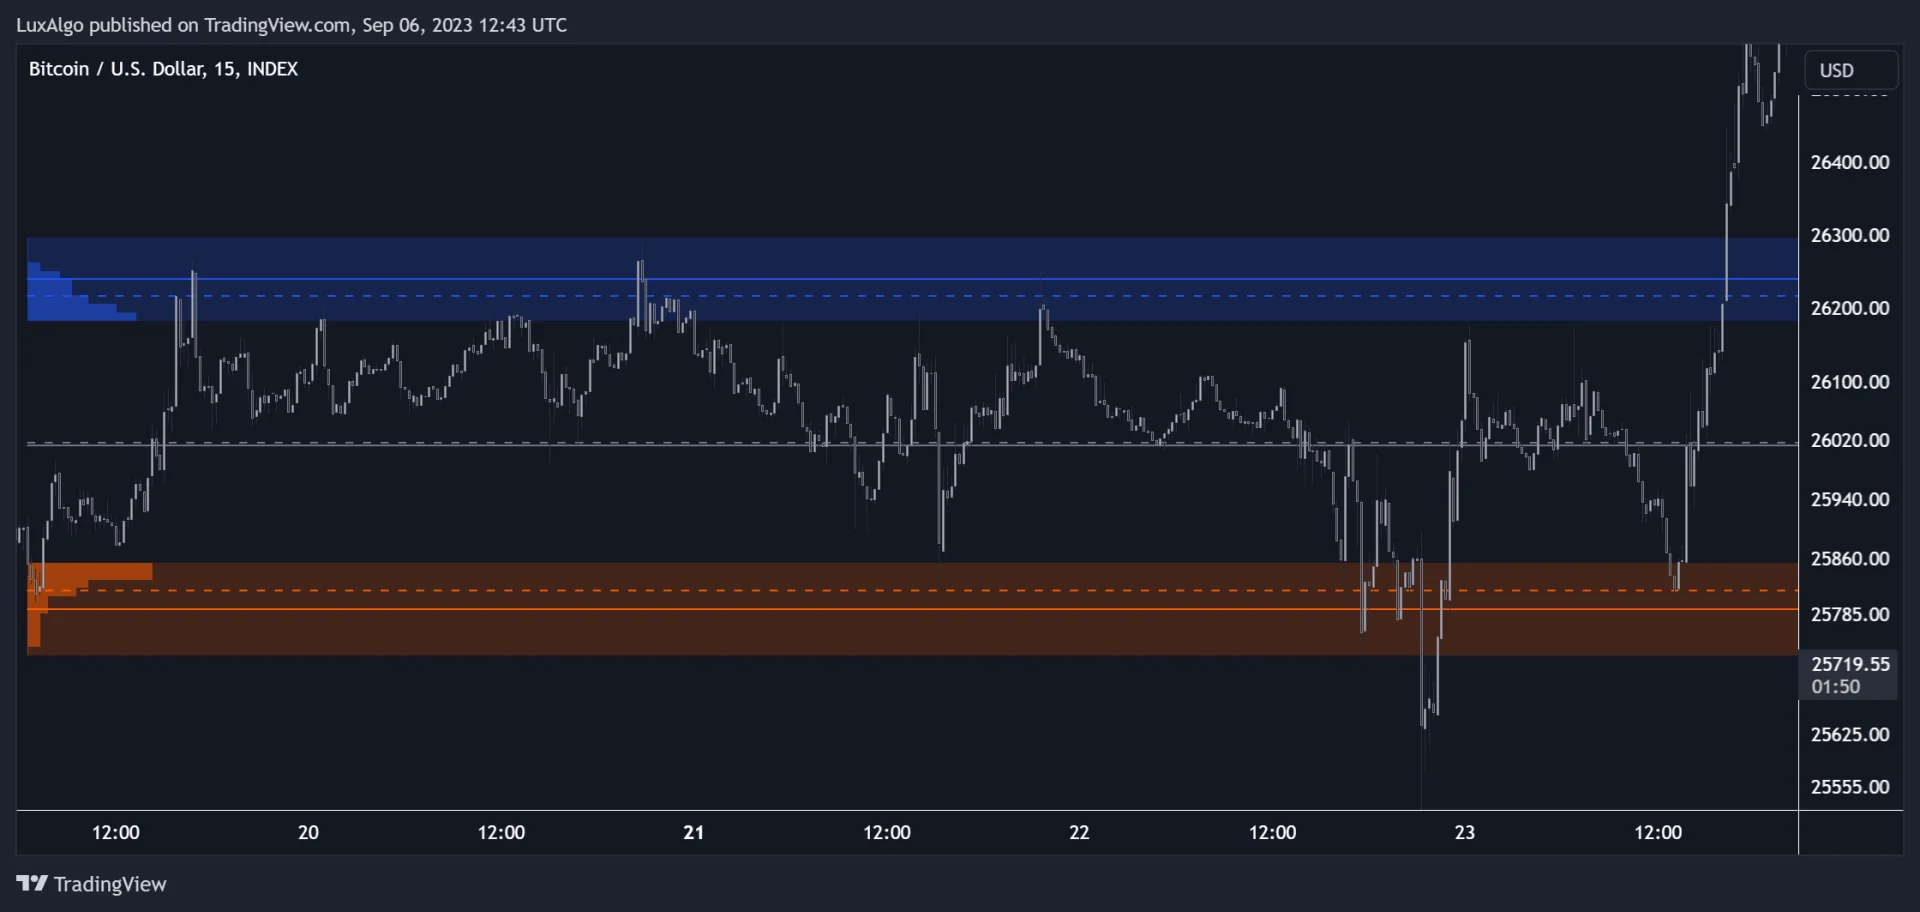
The original LuxAlgo indicator description explains the manual anchors and extended zones. For a historical test, the end anchor must not include bars after the decision being evaluated. A zone drawn with future volume can look convincing while being unavailable to a trader at the time.
| Tool or evidence | Useful question | What it cannot establish alone |
|---|---|---|
| Price candles and structure | How did price arrive, leave, and behave on a return? | The identity or remaining orders of a particular participant. |
| Volume or a volume-derived zone | Where did activity concentrate in the chosen feed and window? | That high activity guarantees a bounce, or that all activity was buying. |
| Order-flow or liquidity display | What does this tool measure: executions, bid/ask classification, or displayed orders? | That every heatmap represents the same data or that displayed orders will stay in place. |
| Momentum indicator | Does the setup meet a defined momentum condition? | An independent edge merely because another price-derived indicator agrees. |
Common Zone Marking Mistakes
- Drawing a narrow box only to obtain an attractive reward-to-risk ratio, or widening it after a trade fails.
- Changing body-versus-wick boundaries from one example to another without recording the change.
- Ignoring the broader trend, nearby opposing zones, spread, or scheduled market events.
- Using a completed higher-timeframe candle before its close was available on a lower-timeframe test.
- Selecting anchors after seeing the outcome, then treating the resulting zone as a real-time signal.
Trading with Supply and Demand Zones
A zone identifies a location to investigate. It does not define the order type or entry trigger. The following examples are hypothetical research rules, not recommendations or reported trades.
Price Bounce Strategy
A bounce approach looks for price to return to a zone and move away again. Decide whether entry is a resting limit order, a completed rejection candle, or a later break of that candle’s high or low. Those choices produce different fills and risks; backtests should not treat them as interchangeable.
Suppose a demand area spans $98–$100. A hypothetical long entry at $100 with an invalidation stop at $97.50 has $2.50 of price risk per share. A $100 price-risk budget allows 40 shares before costs. A $105 target offers $5 per share, or 2R relative to that initial distance. If the trade needs a wider stop, reduce size rather than silently increasing the budget.
| Setup component | Long-side example | Short-side counterpart |
|---|---|---|
| Location | Return to a previously identified demand zone. | Return to a previously identified supply zone. |
| Trigger | The exact rejection or recovery condition specified in advance. | The exact rejection or decline condition specified in advance. |
| Invalidation | A defined price beyond the demand area, with any buffer stated. | A defined price beyond the supply area, with any buffer stated. |
| Sizing | Risk budget divided by loss per unit, adjusted for costs and contract terms. | Same calculation, including borrow or financing costs where relevant. |
Zone Breakout Strategy
A breakout approach investigates a move through the area rather than assuming it will hold. Specify whether a wick, a close, or several completed closes count as a break. A retest entry is a different rule from entering immediately on the break; some moves never retest.
A former demand area may become resistance after a downside break, but that change is not automatic. Increased volume can be a filter to test, not a requirement that makes every break valid. If using a projected range height for a target, identify the range and measure it before entry. The projection is a planning device, not a forecast that must be reached.
Zone Reversal Strategy
A reversal strategy needs evidence that the prior move has changed, such as a defined failed break and recovery or a specified structural event. Candlestick patterns, including tweezer tops, can describe an observation without establishing its win probability. Avoid calling a setup “high probability” unless the claim comes from a relevant, adequately sized test.
To make the original price example explicit, consider a hypothetical short at $27,450 with a stop at $28,000. The initial distance is $550 per unit, about 2.00% of entry price. A $110 price-risk budget corresponds to 0.2 units where the instrument permits that size. A $26,350 target is $1,100 away, or 2R. This is arithmetic, not evidence that such a trade occurred or that the entry was profitable.
ATR can help express a buffer in terms of recent price variability, but an ATR multiple must be specified and tested. It does not measure zone strength. Stops can fill beyond their trigger during gaps or fast markets, so planned risk is not a guaranteed maximum loss.
Advanced Zone Analysis Methods
Using Multiple Indicators
Give each condition a distinct purpose. For example, price might establish the zone, a momentum measure might filter direction, and volume might describe participation. Compare the strategy with and without each added condition. Fewer trades or a higher win rate can coexist with a worse net result.
The Library’s market-structure tools include order blocks, liquidity, and imbalance concepts. Those outputs use their own definitions; an order block is not automatically the same thing as the anchored indicator’s volume-derived area.
Likewise, a money-flow reading or reversal signal from the Library’s momentum tools should only be used according to its documented behavior and a tested rule. Agreement with a zone does not reveal hidden orders or establish an automatic top, bottom, or probability of success.
Multi-Market Zone Trading
Apply the framework to the exact instrument and feed. A stock, a futures contract, spot forex, and a crypto perpetual differ in trading hours, tick value, costs, and available volume. A USD/JPY reaction area can be marked from price, but a prior reversal alone does not prove that strong buy orders remain there.
Use the Quant Charts data documentation to understand coverage. Crypto volume belongs to the exchange shown for the symbol; U.S. equity data from a single exchange is not consolidated market volume. Do not infer market-wide institutional activity from a partial feed, and do not assume every asset supports the same order-flow tools.
A Native LuxAlgo Research Workflow
Start with the chart’s symbol, timeframe, and session. The Quant Charts drawing tools let you mark and manage areas anchored in time and price. Lock a completed drawing in the Object tree to avoid accidental changes, and save the context with the workspace. Keeping an original screenshot makes later revisions to a zone visible in your journal.
Give Quant, our coding agent, precise zone rules rather than asking it to find only “strong” areas. An illustrative specification could be:
Mark the full high-low range of a three-bar base only after a completed bar closes above the base high. Make the zone available from that confirmation onward. Evaluate only the first later return, keep the bounds fixed, and record invalidations below the base low. Treat this as a study first; do not assume a fill whenever price reaches a boundary.
A complete strategy also needs entry timing, order type, stop, target, sizing, and costs. Follow the Making Strategies guide: inspect the generated code and run it manually. Check individual trades against the chart. A historical strategy catalog does not validate your own zone definition.
Results Tracking Methods
- Save the zone’s creation time, original bounds, source settings, and a screenshot before the outcome is known.
- Record entry and exit fills, costs, initial risk, result in R, holding time, and the reason for invalidation or exit.
- Track trade count, average net result, drawdown, and exposure alongside win rate. Separate bounce, breakout, and failed-break setups.
- Reserve unseen history, test nearby settings, and record how many variations were tried. Compare results by market conditions without choosing categories solely because they performed well.
For perspective, recovering from a 95% loss requires a 1,900% gain on the remaining capital: $100 falling to $5 needs another $95 to return to $100. That arithmetic supports controlling losses, but it does not prescribe one risk percentage for every trader. Choose a budget that fits the instrument, total exposure, and the uncertainty of the strategy.
Supply & Demand Trading Course
Summary
Main Points
Treat a supply or demand zone as a defined area to test. Keep the creation time honest, distinguish estimated zones from actual order data, and separate the location from the entry trigger. Bounce, breakout, and reversal approaches require different rules and can all fail.
Tools for a Repeatable Process
Quant Charts provides the charting context, drawings, and relevant Library tools; Quant helps develop explicit studies and strategies. Use those tools to document and test the hypothesis, then judge it by results after costs and on unseen data. The goal is a repeatable decision process, not a chart filled with apparently confirming signals.
Frequently Asked Questions
Are supply and demand zones different from support and resistance?
The terminology overlaps. Support and resistance can also be price areas. Different indicators and trading methods define their zones differently, so specify the calculation or marking rule.
Do these zones show unfilled institutional orders?
Not by themselves. Price and volume-derived zones are estimates or interpretations. They do not identify the owners or remaining size of orders.
Does every additional touch make a zone stronger?
No. Repeated tests provide more observations but can also precede a break. Compare first and later tests rather than assuming a universal relationship.
When can a zone be used in a backtest?
Only after all information required to identify it was available. A zone confirmed by a later candle cannot justify an earlier entry.
How should position size be calculated?
Divide the chosen risk budget by the loss per unit between entry and invalidation, accounting for costs, contract size, and permitted increments. Slippage can make realized loss larger.
Can Quant help research a zone strategy?
Yes. Define the zone, confirmation time, entry, exit, sizing, and costs. Inspect the generated code and run it manually, then verify trades against the chart and evaluate unseen history.
References
LuxAlgo Resources
- Supply and Demand Anchored Indicator
- Quant Charts Drawing Tools
- LuxAlgo Quant
- Making Strategies with Quant
- Quant Charts Data and Market Coverage
- LuxAlgo’s Original Supply and Demand Anchored Script
External Resources
Read next