

Explore essential chart patterns like Head & Shoulders and Double Tops that help traders identify trends and manage risks effectively.
Key Takeaways:
- What are Chart Patterns? Recurring price shapes that signal trend reversals or continuations. Examples include Head & Shoulders, Double Tops/Bottoms, and Triangle patterns.
- Why Use Them? They help traders identify trends, time entries/exits, and improve risk management when combined with technical tools like RSI and volume analysis.
- Success Rates: Patterns such as the Cup & Handle have a 95 % likelihood of breaking even, while Head & Shoulders bottoms succeed 90 % of the time.
Popular Patterns:
- Head & Shoulders: Signals bearish reversals. Trade after neckline breaks with volume.
- Double Tops/Bottoms: Indicates reversals at key levels. Confirm with volume changes.
- Triangle Patterns: Highlights breakout opportunities. Watch volume for confirmation.
Quick Comparison Table:
| Pattern Type | Signal Type | Key Feature | Confirmation |
|---|---|---|---|
| Head & Shoulders | Bearish reversal | Three peaks, middle highest | Neckline break |
| Double Tops/Bottoms | Reversal | Two similar peaks/troughs | Volume & breakout |
| Triangle Patterns | Continuation / reversal | Converging trend-lines | Volume surge |
Pro Tip: Combine chart patterns with indicators like RSI, MACD, and volume analysis for stronger confirmation. Use multiple time-frames to validate trends and manage risks effectively.
Ready to dive deeper? Let’s break down each pattern and how to trade them successfully.
Chart Pattern Analysis: Double Top, Double Bottom, and Head & Shoulder Patterns
Head & Shoulders Pattern
The head & shoulders pattern flags a potential shift from an up-trend to a down-trend. It features three peaks: the highest peak (the head) flanked by two lower peaks (the shoulders).
Pattern Structure
Key components:
- Left Shoulder: First peak, hinting at weaker bullish momentum.
- Head: Tallest peak, marking bullish exhaustion.
- Right Shoulder: Lower peak, confirming reduced buying interest.
- Neckline: Support line connecting the troughs; a break confirms the trend reversal.
| Component | Characteristics | Significance |
|---|---|---|
| Left Shoulder | First peak in the up-trend | Early sign of waning demand |
| Head | Highest peak | Shows bullish exhaustion |
| Right Shoulder | Lower peak after head | Confirms fading strength |
| Neckline | Support through troughs | Break signals bearish shift |
Trading Methods
- Entry: Short once price closes below the neckline on high volume.
- Stop Loss: Above the head or the right shoulder.
- Profit Target: Measure the height from head to neckline and project it downward.
Risk Factors
- Ensure the pattern is complete before trading.
- Confirm the neckline break with heavy volume.
- Trail stops (e.g., Fibonacci Trailing Stop) to secure gains.
- Avoid anticipatory entries—wait for confirmation.
- Size positions relative to the stop distance.
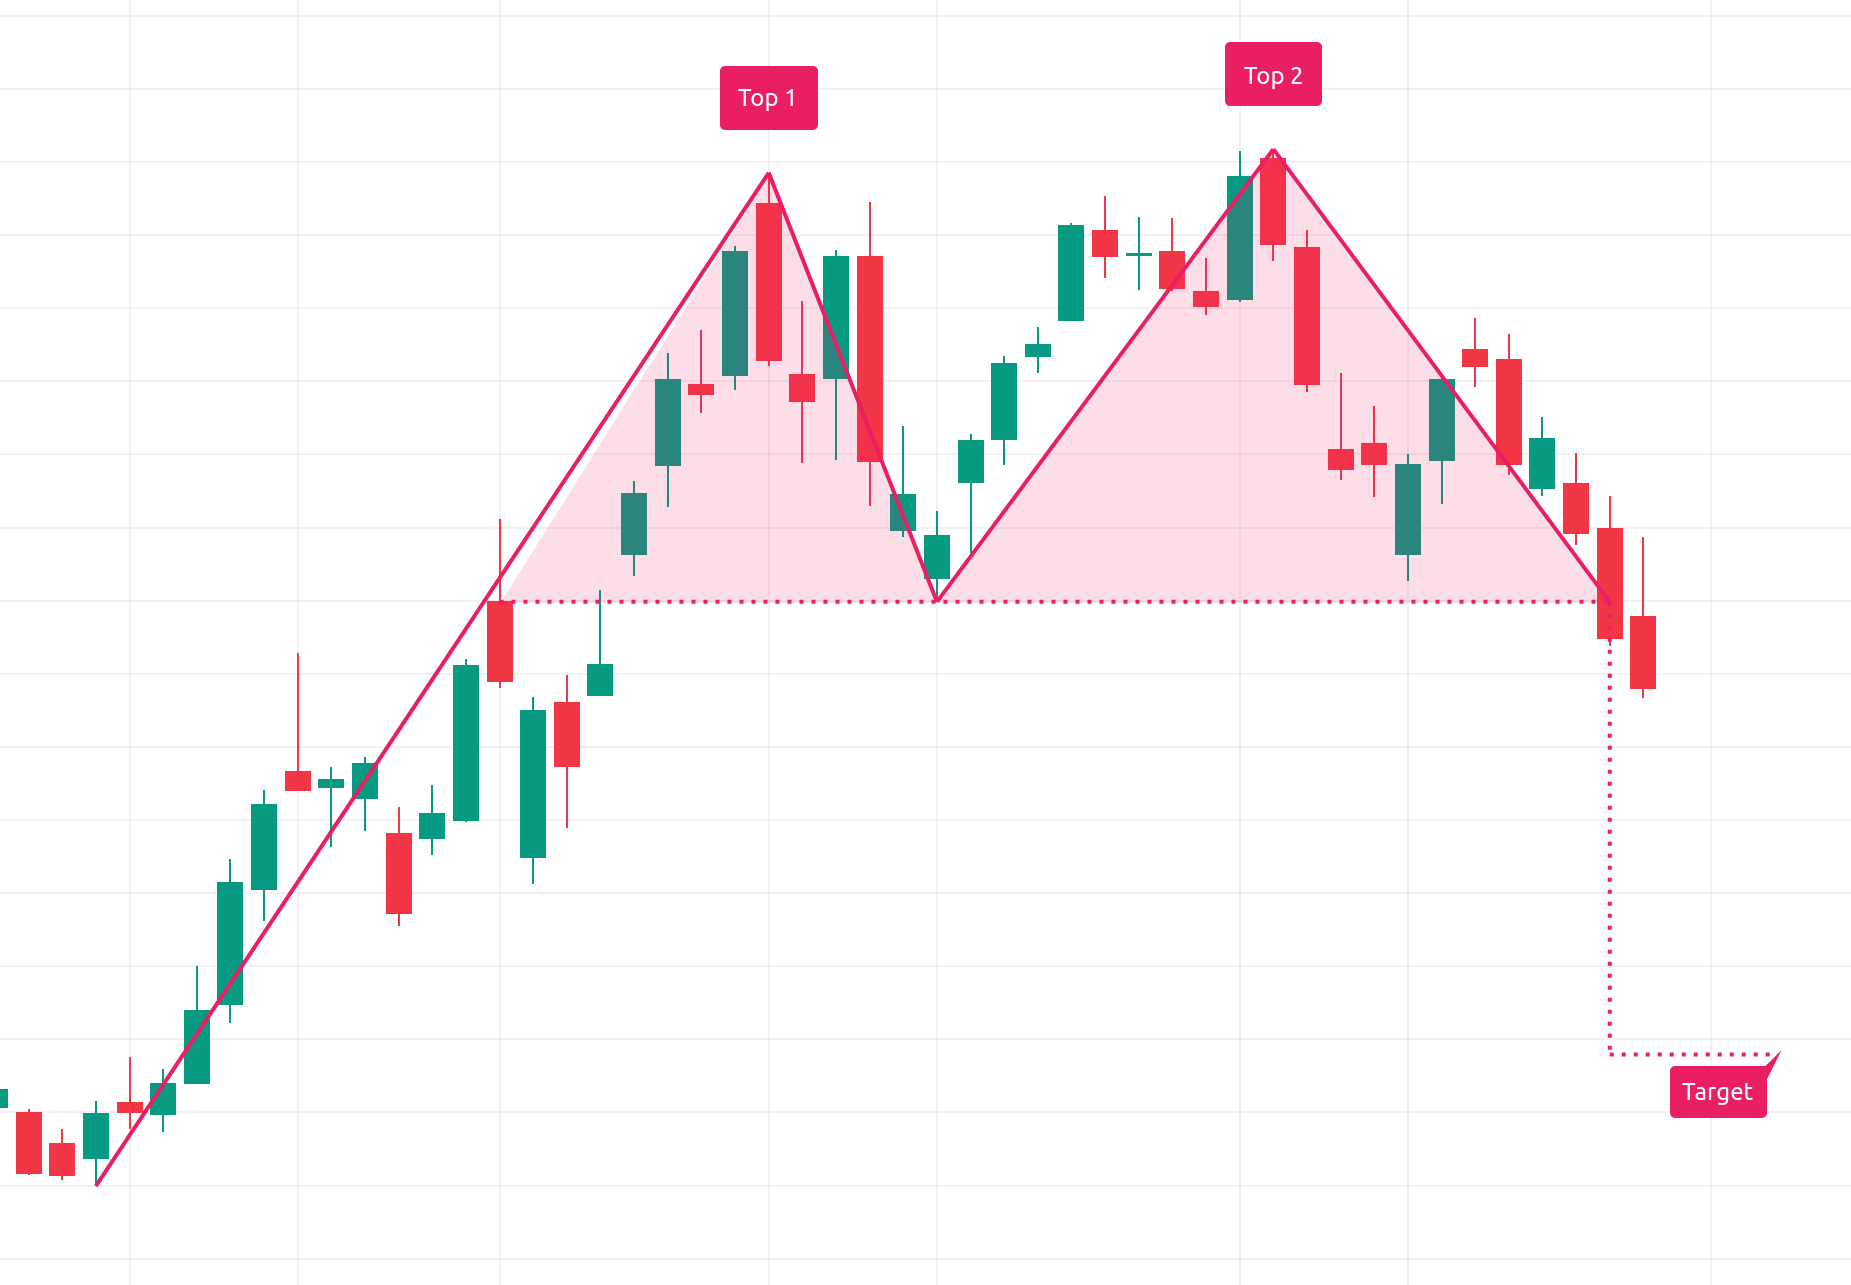
Double Tops & Bottoms
Double tops and bottoms signal likely trend reversals, providing a practical extension to head & shoulder analysis.
Pattern Features
| Feature | Double Top | Double Bottom |
|---|---|---|
| Formation | Two peaks at similar prices | Two troughs at similar prices |
| Trend requirement | Follows an up-trend | Follows a down-trend |
| Neckline | Support through troughs | Resistance through peaks |
| Volume | Lower on second peak | Higher on second trough |
| Signal | Bearish reversal | Bullish reversal |
Price Targets & Stops
For a double top, short after a decisive neckline break. Project the height of the formation downward and pursue at least a 1 : 2 risk-to-reward ratio.
Example: In Sep–Oct 2018, Amazon (AMZN) formed a double top near $2 050; once price slipped below the $1 880 neckline, it dropped 31 %.
Pattern Confirmation
- Volume: Declining on the second peak (top) or rising on the second trough (bottom).
- Price Action: Enter only after a clean neckline break.
- Completion: Peaks/troughs must form at comparable levels.
Netflix (NFLX) offered a textbook confirmation in 2022: once price broke below $380 support, it fell 39 % to $231.
Triangle Patterns
Triangles mark consolidations that often precede continuation moves (or, occasionally, reversals) and can be traded on breakout.
3 Main Triangle Types
| Pattern Type | Key Features | Signal Type | Breakout Direction |
|---|---|---|---|
| Ascending | Flat resistance, rising support | Bullish continuation | Upward |
| Descending | Flat support, falling resistance | Bearish continuation | Downward |
| Symmetrical | Converging trend-lines | Neutral continuation | Either direction |
Volume Analysis
Volume typically contracts during pattern formation, then surges on breakout. A sustained rise in volume post-break confirms validity.
Trading Triangle Breakouts
- Entry: Enter after a clear close beyond the triangle boundary on high momentum.
- Target: Measure the triangle’s widest height and project from breakout.
- Risk: Place stops below the last swing low (bullish) or above the last swing high (bearish).
“Only when the price breaks the flat top with high momentum and then also closes above the flat top is the entry valid.” – Rolf
Price Action Concepts Pattern Detection
The Pattern Detection feature in LuxAlgo’s Price Action Concepts toolkit on TradingView automatically highlights formations—such as double tops, head & shoulders, wedges, and channels—directly on the chart. Instead of manually drawing trend-lines, traders can let Pattern Detection scan each bar in real time, label completed structures, and even project potential extensions.
- Filter detections by pattern category, confirmation strength, or timeframe to keep charts tidy.
- Detections appear as native TradingView objects, so you can create alerts for breakouts or retests.
- Combines seamlessly with other Price Action Concepts tools like liquidity zones and market-structure shifts, helping traders contextualize setups faster.
Learn more in the Price Action Concepts documentation.
Using Chart Patterns Effectively
Layer chart patterns with complementary indicators and multi-time-frame confirmation while respecting limitations.
Adding Technical Indicators
| Indicator Type | Purpose | Example Combo |
|---|---|---|
| Trend | Confirm direction | Moving averages + double bottoms |
| Momentum | Gauge strength | RSI + triangle breakout |
| Volume | Validate activity | Volume surge + ascending triangle |
| Volatility | Assess risk | Bollinger Bands + reversal patterns |
Multiple Time-Frame Analysis
- Weekly / Daily – swing trading
- Daily / 4-hour – position trading
- 4-hour / 30-minute – day trading
- 1-hour / 5-minute – scalping
Pattern Limitations
- Patterns are subjective—wait for full confirmation.
- Volume is crucial for validating breakouts.
- Position-size relative to pattern reliability.
- Respect broader market context and volatility.
Summary
| Pattern | Key Features | Primary Signal | Volume Cue |
|---|---|---|---|
| Head & Shoulders | Three peaks, middle highest | Bearish on neckline break | Volume spike on breakdown |
| Double Top/Bottom | Two equal peaks or troughs | Reversal at key level | Volume confirms breakout |
| Triangle Patterns | Converging trend-lines | Continuation or reversal | Volume surge on breakout |
“Chart patterns are used within the study of technical analysis to help traders understand and interpret market sentiment as well as to develop trading plans,” says Brad Ritter of TrendSpider.
Next Steps
- Back-test historical charts and refine trend-line drawing skills.
- Incorporate momentum, volume, and multi-time-frame confirmation.
- Stay objective—never force a pattern.
References
- LuxAlgo Docs – Oscillator Matrix Reversal Signals
- LuxAlgo Docs – Price Action Concepts Pattern Detection
- LuxAlgo Blog – Head & Shoulders Pattern
- LuxAlgo Blog – Double Tops & Bottoms
- Wikipedia – Relative Strength Index
- Wikipedia – MACD
- Wikipedia – Bollinger Bands
- Amazon Investor Relations
- Netflix Investor Relations
- TrendSpider – Charting Platform


