The Head & Shoulders Pattern – Most Traders Misidentify
A head and shoulders pattern is a candidate reversal structure with three main swings and a neckline connecting the two intervening turns. The middle swing extends beyond the shoulders. Recognizing that shape is only the beginning: the prior trend, confirmation rule and information available at the time determine what can actually be tested.
This guide covers tops, inverse formations and complex variations, preserves the original historical examples, and explains how to distinguish a price projection from an executable trading plan.
Identify the Top and Its Inverse
| Feature | Head and shoulders top | Inverse head and shoulders |
|---|---|---|
| Prior movement | An advance that the candidate could reverse | A decline that the candidate could reverse |
| Central structure | Three peaks, with the head above both shoulders | Three valleys, with the head below both shoulders |
| Neckline anchors | The two intervening lows | The two intervening highs |
| Hypothesis after confirmation | A possible downward reversal | A possible upward reversal |
| Common identification error | Calling any three peaks a completed reversal | Calling any three valleys a completed reversal |
The shoulders are commonly similar in height and spacing, but approximate symmetry is not an equation that market prices must satisfy. Record the permitted differences and the swing-selection method. A visually neat formation does not, by itself, establish a better trading result.
A neckline may slope. Keep its original anchors fixed when assessing a candidate; moving them after a failed break changes the rule. A top connects the lows between the peaks, while an inverse formation connects the highs between the valleys.
Define Confirmation Before the Break
A shoulder drawing alone is not confirmation. Specify whether the rule requires a close beyond a boundary, an intrabar crossing, a buffer or another condition. These choices produce different entry times and should not be mixed in a performance sample.
Bulkowski’s top-pattern guidelines use a close below an upward-sloping neckline, or below the right intervening low when the neckline slopes down. His inverse-pattern guidelines mirror that treatment: a close above a downward-sloping neckline, or above the right intervening high when the neckline slopes up. This is a particular convention; a strategy that always uses the extended neckline should be labeled separately.
Volume is useful context, not a universal pass/fail rule. The original article described declining volume as mandatory. Instead, define the volume condition if using one and test its contribution. Low breakout volume alone cannot prove either failure or success. Compare like-for-like data: an exchange-specific volume series is not the same as consolidated activity.
Historical Top: PGAL Was Still a Candidate
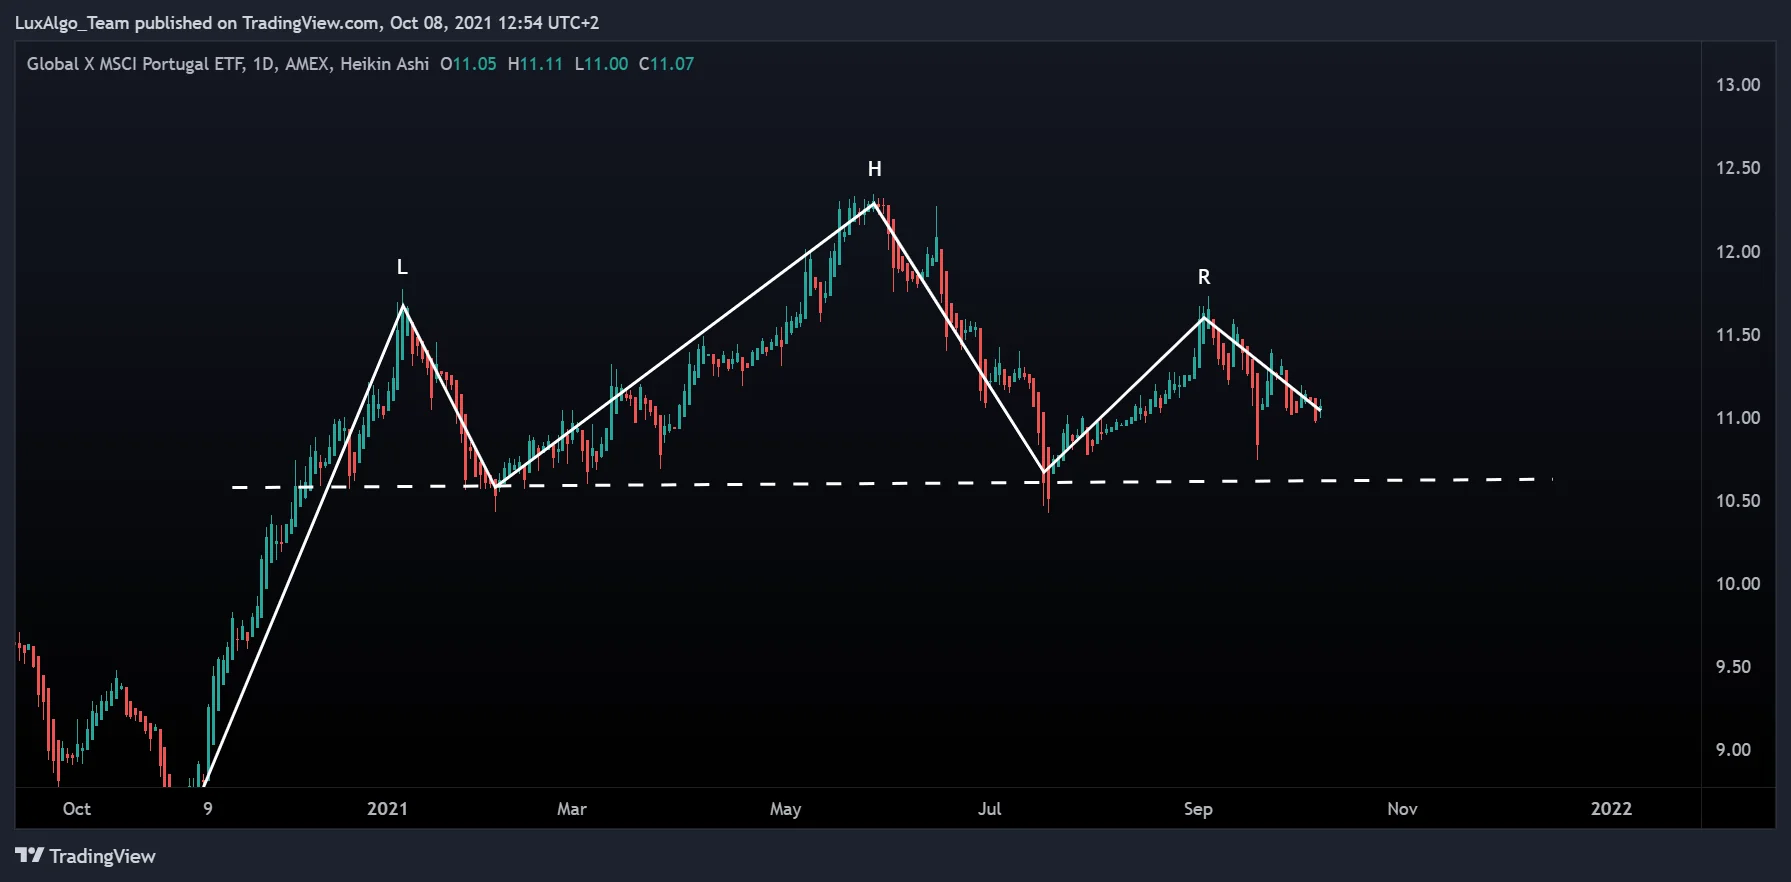
The chart explicitly uses Heikin Ashi candles. These transformed candle values are useful for visual smoothing but must not be treated as ordinary executable OHLC prices. Recheck swing locations, confirmation and fills on the price series used by the actual strategy. A chart illustration is not an execution record.
Historical Inverse Pattern: MTSI
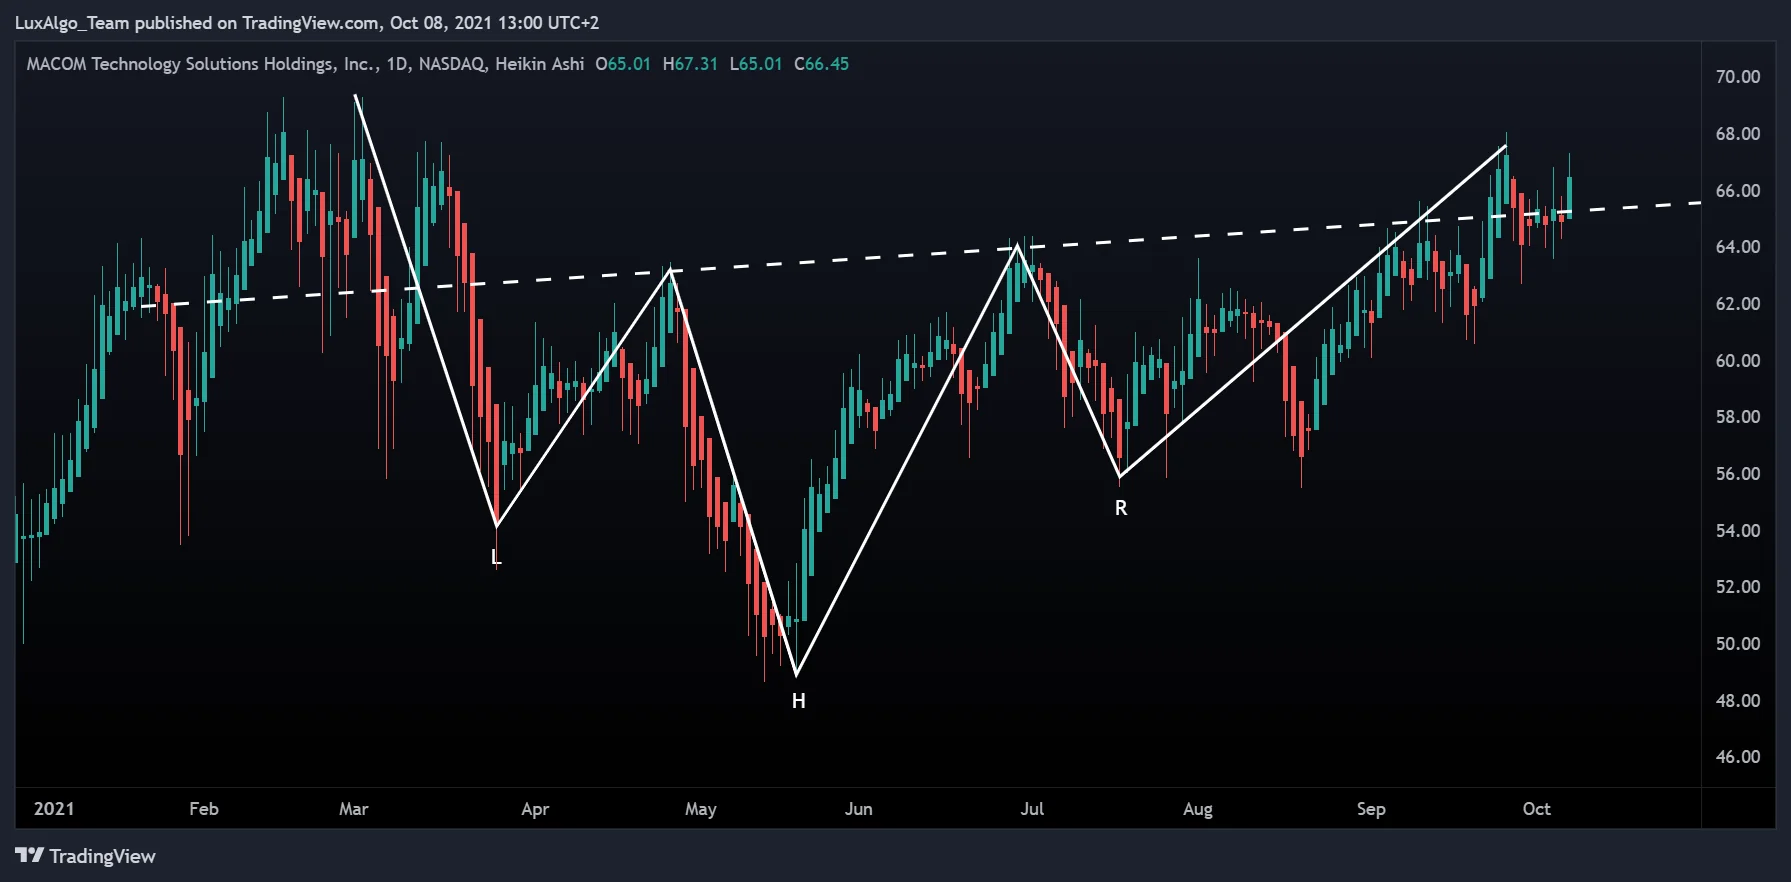
The right intervening high and the upward-sloping neckline are different references. Choose the confirmation convention before evaluating the example. A later chart makes the selected shoulders and head easy to see, but a live observer may have needed additional bars to identify each turn.
TradingView’s repainting documentation explains why a pivot plotted back on its swing bar may only become known later. Preserve that delay in the test. Retrospective labels must not become earlier entry signals.
Complex Formations Need Explicit Point Selection
Complex versions can contain multiple shoulders, multiple heads or both. Extra turns create more choices about which points count. Specify the grouping criteria and conditions that cancel a candidate before selecting successful examples; do not keep expanding a failed candidate until a later reversal fits.
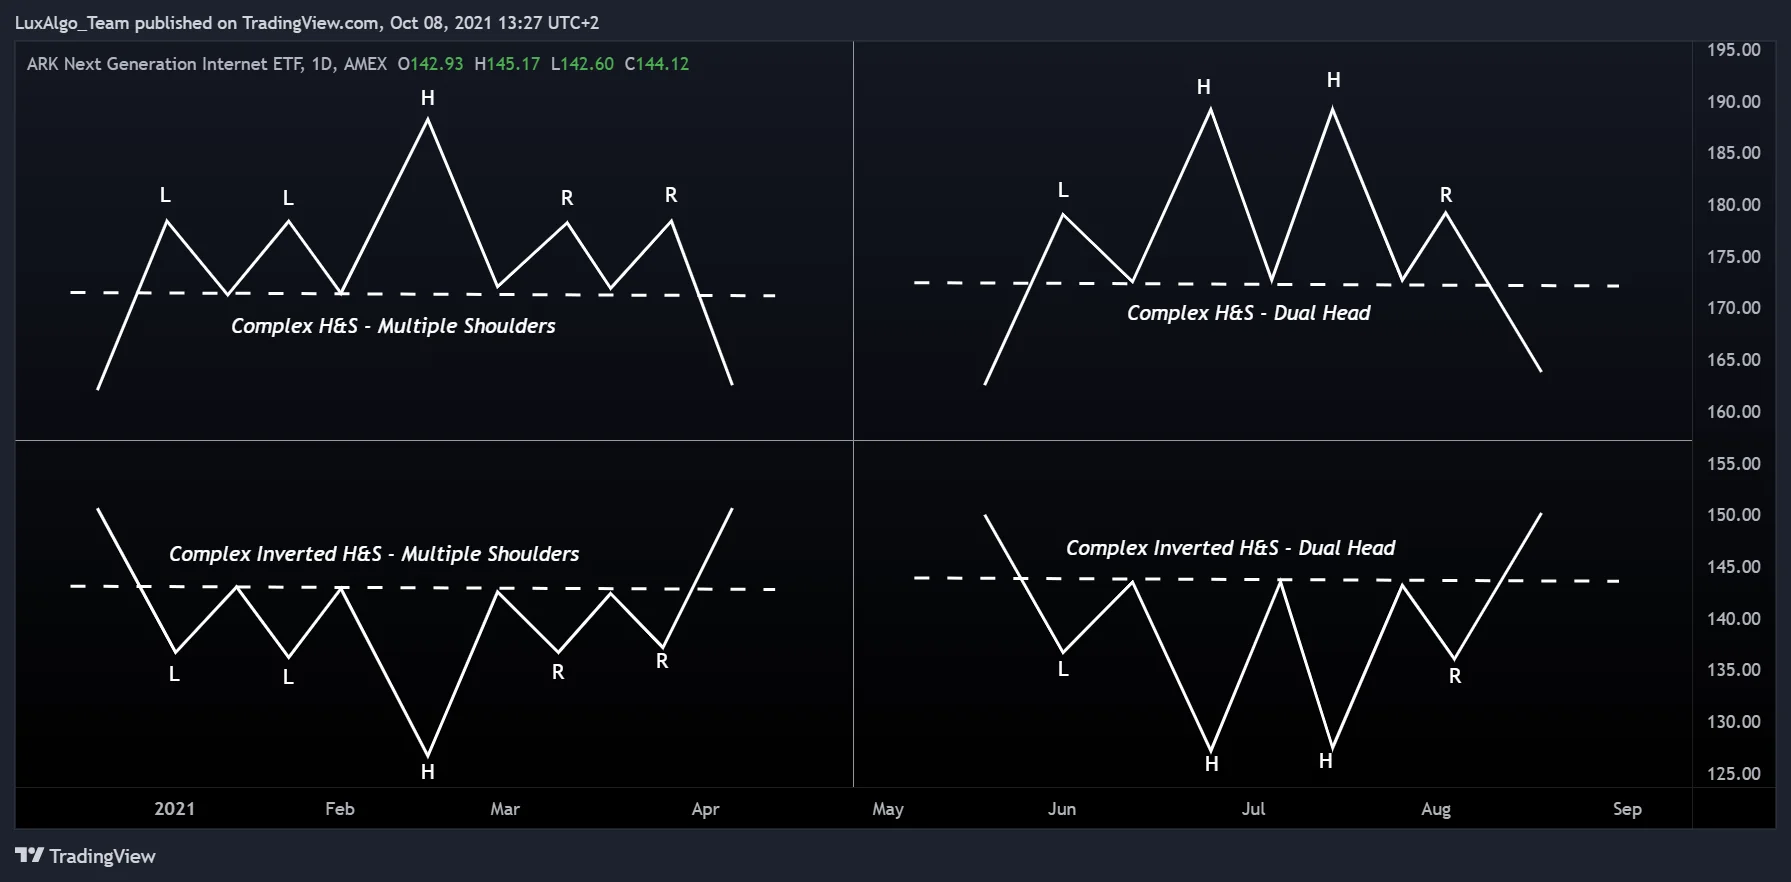
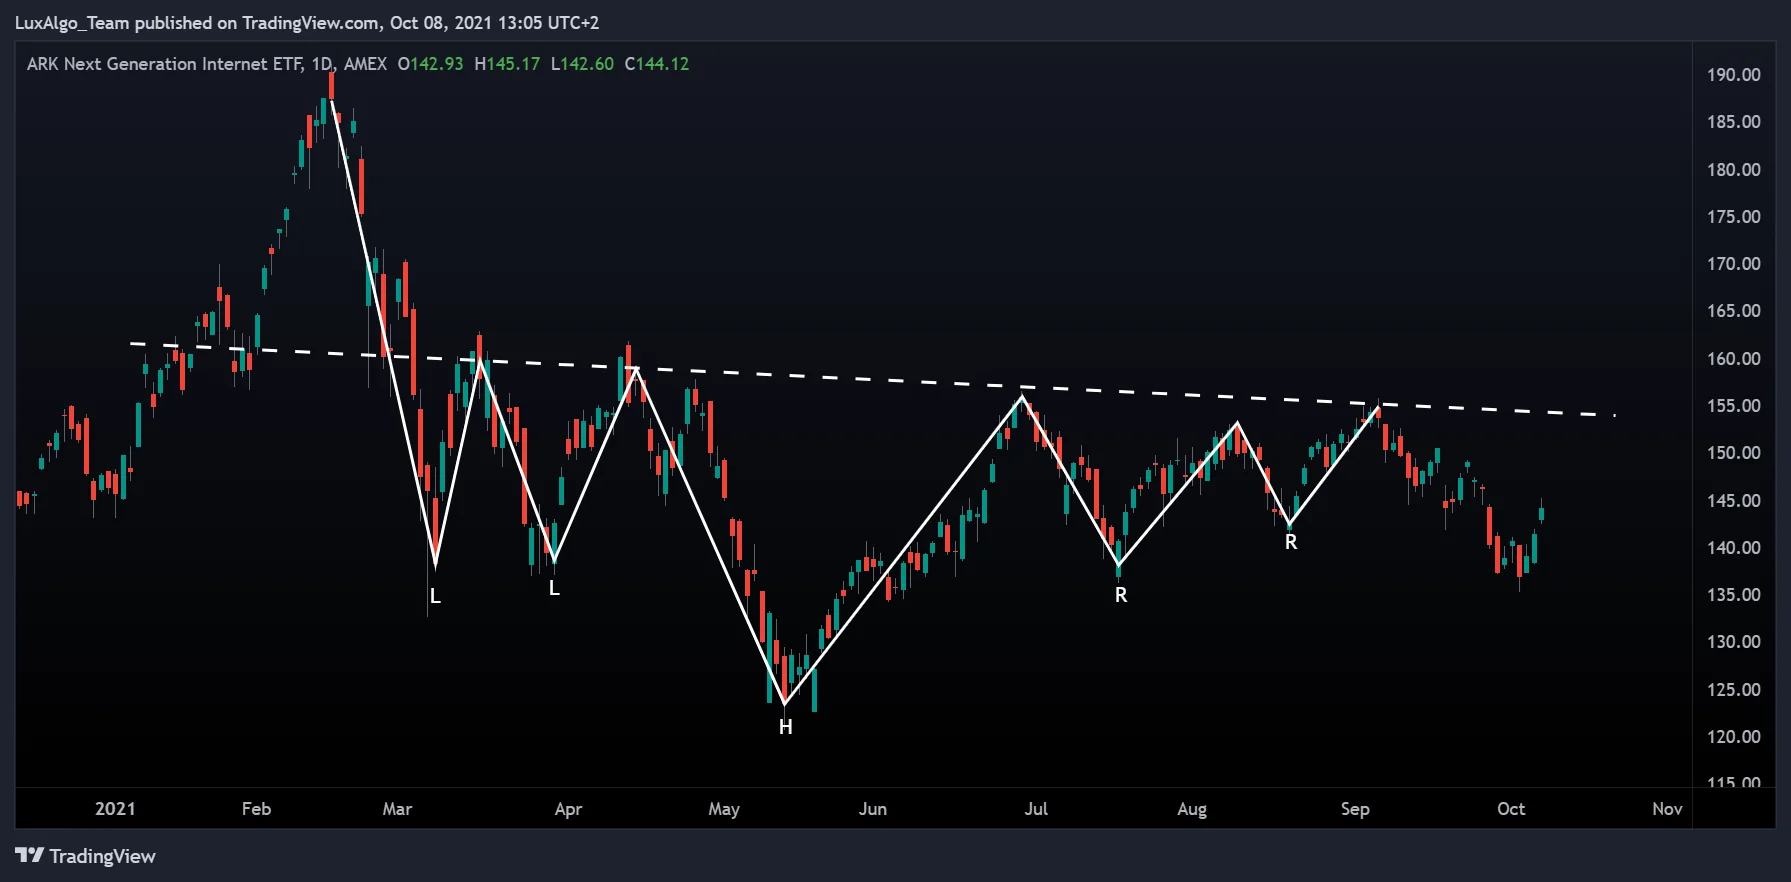
For multiple heads, document the selected extreme and its corresponding neckline value. The original blanket instruction to choose the lowest head is not applicable to both directions: a top concerns upper peaks, whereas an inverse formation concerns lower valleys. Different complex-pattern conventions should be evaluated separately.
Calculate a Reference Target Without Treating It as a Forecast
The basic full-height construction measures the vertical price distance between the head and the neckline at the head’s time. Project that distance from the defined breakout reference: subtract it for a top and add it for an inverse formation. With a sloping neckline, its value at the head can differ from its value at the breakout.
| Hypothetical case | Height calculation | Full-height reference |
|---|---|---|
| Top | Head 120 minus neckline 100 at the head = 20 | Breakout reference 98 minus 20 = 78 |
| Inverse | Neckline 100 at the head minus head 80 = 20 | Breakout reference 103 plus 20 = 123 |
These are arithmetic illustrations, not expected returns. Bulkowski’s cited trading tips also describe scaling the height by a sample-based target-hit percentage. That adjustment differs from the full-height construction shown here, and its historical percentage should not be transferred mechanically to another instrument, interval or rule.
A reference target does not determine stop placement, position size or a guaranteed exit. Choose invalidation and management rules separately. If a calculated price is economically impossible for the instrument, the geometric projection is not a usable target.
Build an Execution Plan and Keep the Failures
- Record the swing-definition delay, neckline anchors and exact confirmation condition.
- Specify entry timing, invalidation, target management and any time-based exit.
- Include spread, fees, slippage and, for short positions, availability and borrowing or funding assumptions.
- Keep failed, incomplete and missed candidates in the research record.
- Evaluate a fixed rule on a later period instead of repeatedly tuning it to familiar charts.
For a hypothetical short entry at 98 and an exit trigger at 104, planned price risk is 6 per unit. A 300 price-risk budget corresponds to 50 units before costs. If the position is covered at 107 after a gap, the price loss is 450. A stop reference does not cap the realized loss.
Investor.gov’s order guide explains that a market order does not guarantee price and a limit order may not execute. Check the behavior supported by the actual broker and instrument before interpreting a backtest as tradable.
Some patterns overlap with broader formations, including diamond-like structures. Multiple names for the same price history are not independent confirmations. A failed neckline break, a return inside the formation or a missed target must remain part of the results.
What the Original Research Actually Shows
Carol Osler’s 1998 New York Fed staff report studied a specific group of head-and-shoulders traders in US equities. Its abstract reports unprofitable trading and temporary price effects that disappeared within two weeks. That is a finding in the paper’s setting, not a universal two-week reversal clock for every market or a claim that the pattern guarantees profits.
Caginalp and Balevonich’s A Theoretical Foundation for Technical Analysis appeared in the Journal of Technical Analysis in 2003; its SSRN entry was posted in 2005. Their dynamical model can generate head-and-shoulders structures from one modeled group. A theoretical mechanism does not identify the actual participants behind a particular chart or establish an executable trading edge.
Test the Rule in LuxAlgo’s Native Charts
Use LuxAlgo’s native charts to define the symbol, interval, price source and confirmation convention. Start with standard candles for execution-oriented tests, then compare any transformed display separately. Keep development observations apart from later evaluation.
Ask Quant, our coding agent to express a supported strategy hypothesis with explicit swings, confirmation, exits and sizing. Inspect the generated code and run it manually. Review strategy settings and individual trades to check that later-confirmed turns are not used before they become available.
Check native data coverage and available history. The documented US-equity source is Cboe EDGX rather than a consolidated all-venue feed. Re-run the experiment after changing its symbol, interval or assumptions.
Frequently Asked Questions
What distinguishes a head and shoulders top?
It has three main peaks after an advance, with the middle peak above both shoulders. The shape remains a candidate until the chosen confirmation condition occurs.
Is an inverse pattern simply three lows?
No. It needs a lower central valley, relevant prior decline, defined neckline anchors and an explicit confirmation rule. Three lows alone do not establish a completed reversal.
Must the shoulders be perfectly symmetrical?
No. Similar height and spacing are common identification guidelines, but any permitted tolerance should be defined before testing. Visual symmetry does not guarantee performance.
Does the measured target set the stop-loss?
No. A height projection is a reference level. Invalidation, position size and execution rules must be specified separately, and the target may never be reached.
How can LuxAlgo help test this pattern?
Use native charts and Quant to express supported rules for identifying turns and confirming breakouts. Inspect the generated code and run it manually, then review individual trades, costs and a later evaluation period.
Read next