
Learn how to identify and trade double top patterns effectively, focusing on breakdown signals, risk management, and trading strategies.
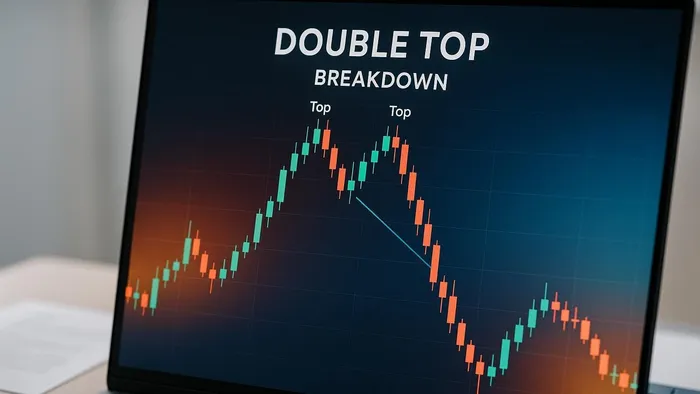
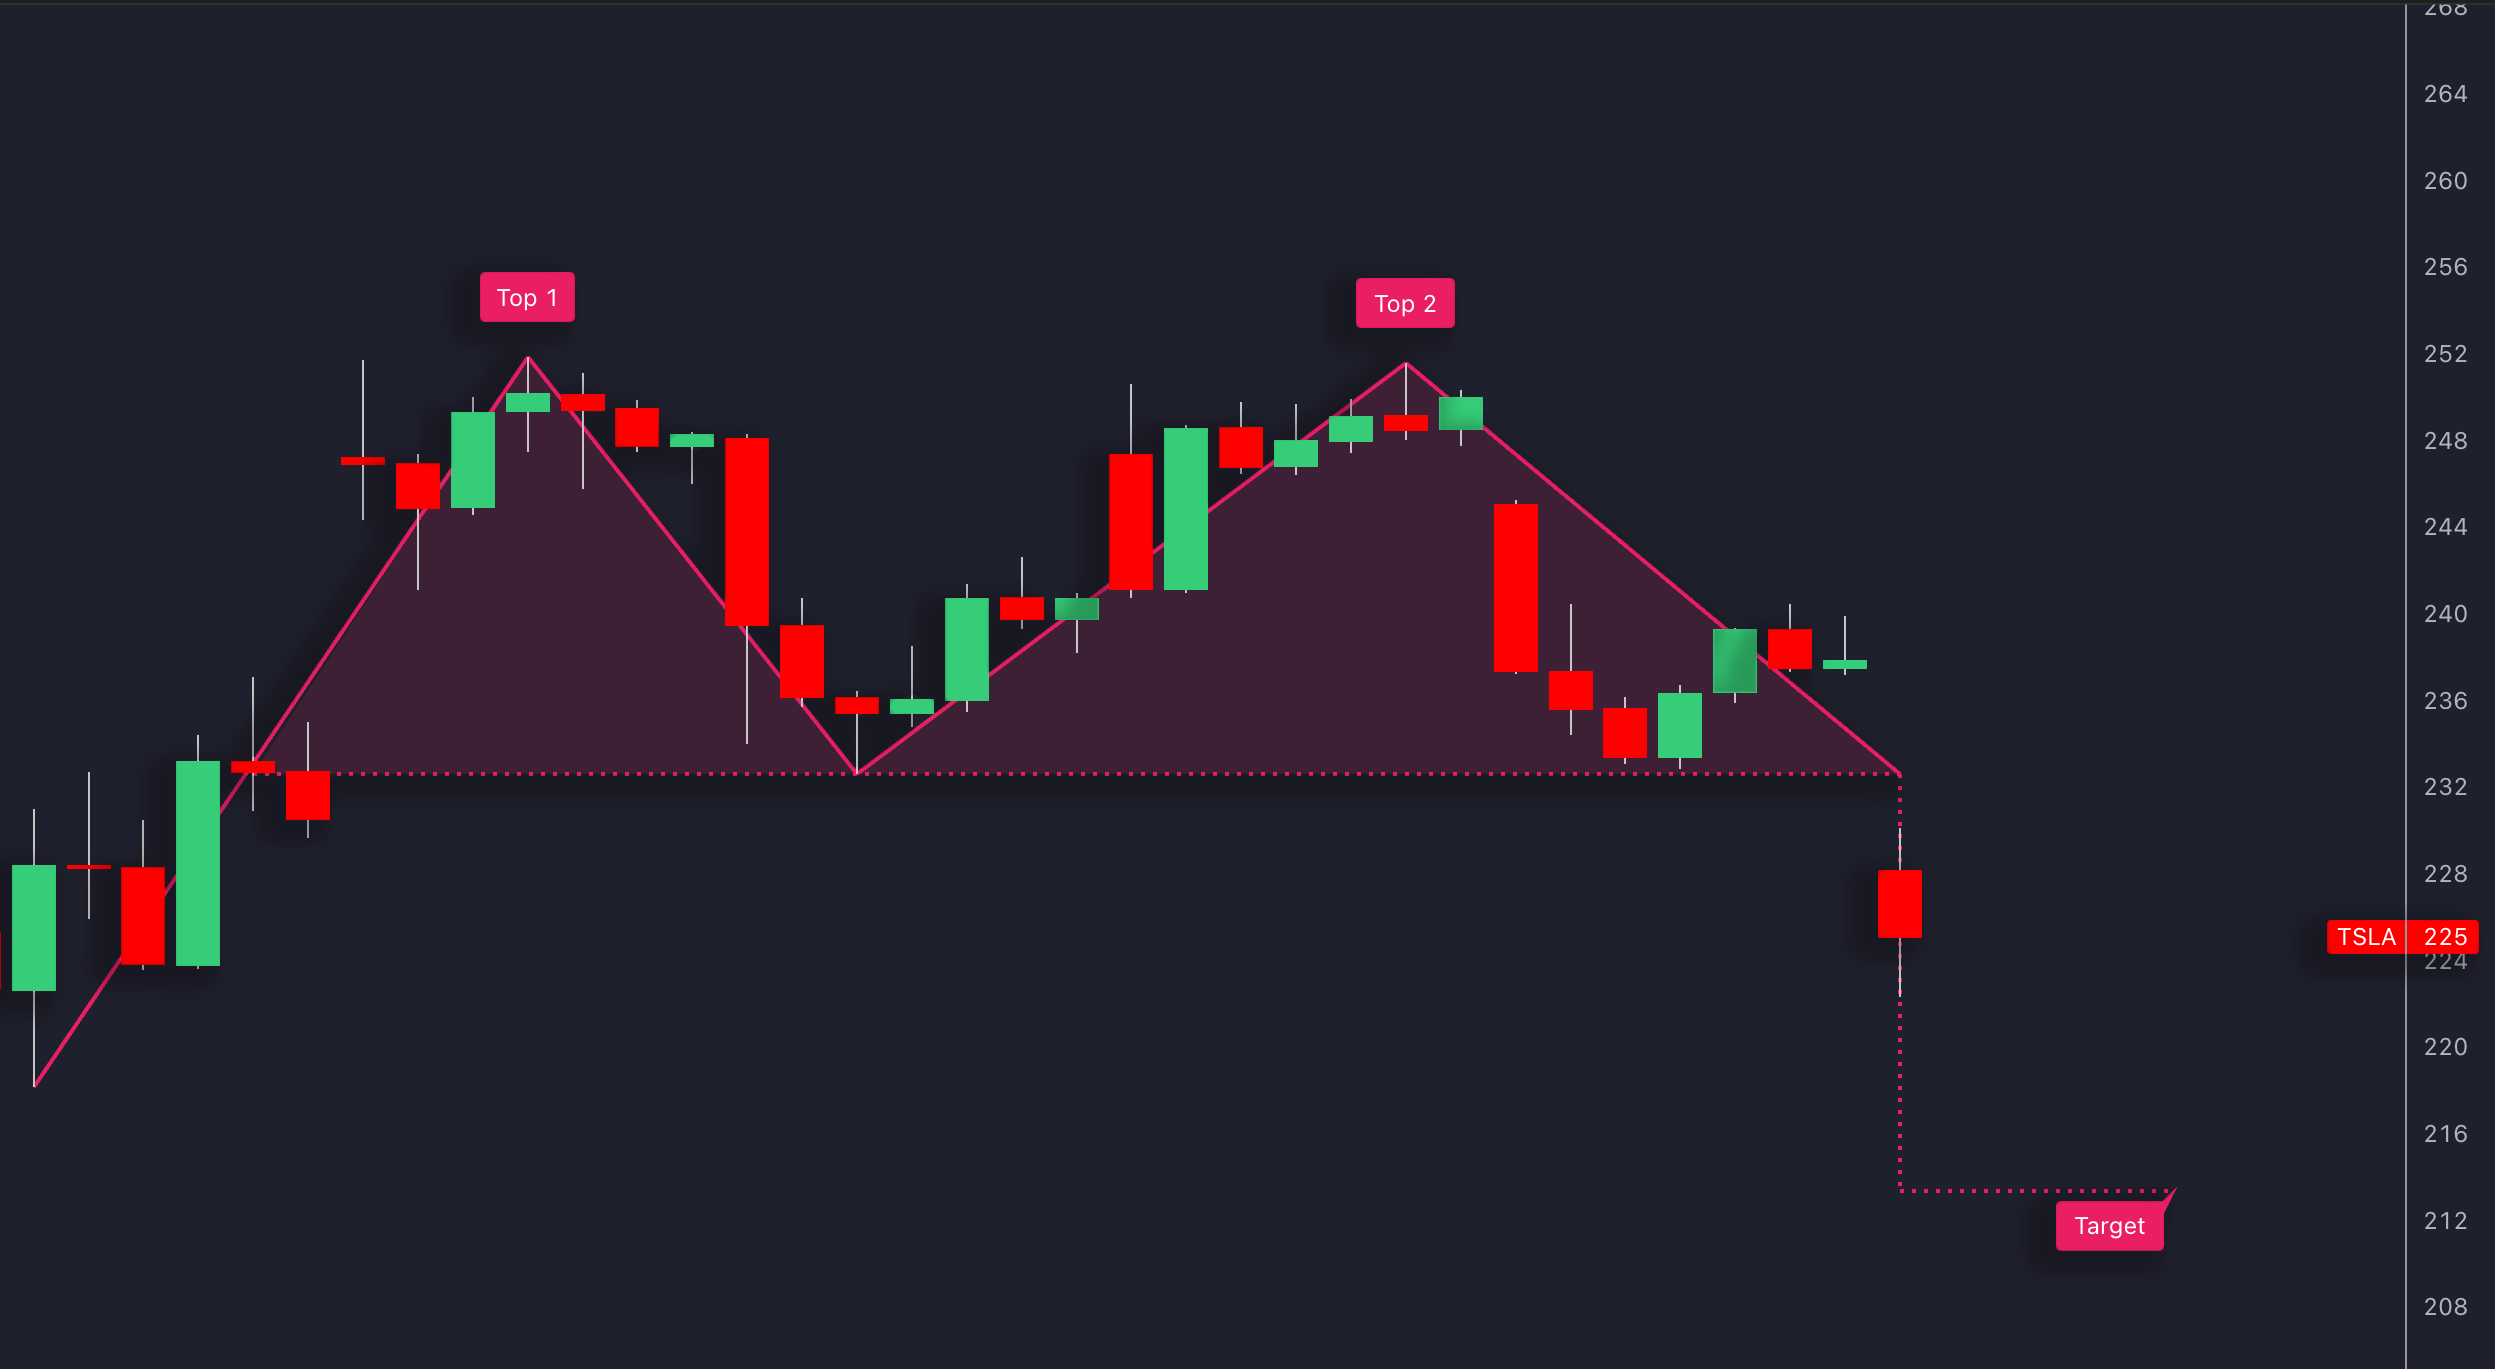
The double top pattern is a bearish signal that often marks the end of an uptrend and the start of a downtrend. It forms when the price reaches two similar peaks, creating an “M” shape, and confirms when the price breaks below the neckline (the low point between the peaks). Traders usually prefer to see both peaks printed within a reasonable number of bars and at comparable price levels, because symmetry adds weight to the setup.
Key Takeaways:
- What to Look For:
- Two peaks at similar levels, separated by a dip.
- A breakdown occurs when the price closes below the neckline.
- Volume typically drops at the second peak and surges at the breakdown.
- Confirmation Tools:
- Use RSI (LuxAlgo Library) for bearish divergence and overbought signals.
- Complement with Ichimoku Cloud to visualise key support and resistance zones.
- Watch for reduced buying activity and momentum loss at the second peak.
- How to Trade:
- Enter at the neckline breakdown or after a retest.
- Set profit targets based on the pattern height and stop-loss above the neckline.
Pro Tip: Avoid early entries, always wait for a confirmed breakdown with strong volume for better accuracy. Use proper risk management by maintaining a risk-reward ratio of at least 1:3. You can quickly test variations of this setup with AI Backtesting, LuxAlgo’s AI agent for creating trading strategies.
This pattern works best on higher timeframes such as daily or weekly charts and is a powerful resource for spotting trend reversals.
How to Trade the Double Top Pattern: Forex Chart Patterns
Spotting Double Top Breakdowns
Identifying the right signals is key to confirming double top patterns and their breakdowns.
Breakdown Signs
A breakdown is confirmed once the price closes below the neckline. Look for these signs:
- A closing candle below the neckline
- A volume surge when the breakdown occurs, ideally exceeding the twenty-period average
- Weaker momentum at the second peak
- Reduced volume during the formation of the second peak
“A double top is only valid when the price breaks and a candle closes below the neckline.” – Alchemy Markets
Next, use technical tools to strengthen the confirmation of the pattern.
Technical Confirmation Tools
You can verify a double top breakdown by using these technical indicators:
Volume Analysis
Pay attention to how volume behaves during the pattern’s formation:
- Volume declines as the second peak forms
- A surge in volume when the neckline breaks
- Comparison of volumes at the two peaks reveals reduced buying activity
RSI and Momentum Indicators
RSI helps confirm the pattern by showing:
- Bearish divergence between the two peaks
- Overbought conditions at the second peak
- Loss of momentum before the breakdown
| Confirmation Signal | What to Look For | Why It Matters |
|---|---|---|
| Volume Pattern | Decline at the second peak, surge at breakdown | Reflects reduced buying pressure |
| Price Action | Closing candle below the neckline | Confirms the pattern is complete |
| RSI | Bearish divergence between peaks | Highlights fading momentum |
For instance, in 2020 Amazon’s stock displayed a clear double top. Volume dropped as the second peak formed and then spiked when the neckline was broken, confirming the pattern and signalling a sharp downward move.
Double top patterns observed on higher timeframes, such as four-hour, daily, or weekly charts, tend to provide more reliable signals of major trend reversals.
Short-Selling Strategy
Trade Entry Methods
There are two main ways to enter a short trade on a double top breakdown: the immediate breakdown entry and the retest entry.
Immediate Breakdown Entry
This method involves entering the trade as soon as the price breaks below the neckline. Use the confirmation signals discussed earlier to validate the breakdown.
Retest Entry
Here, you wait for the price to pull back to the neckline after the initial breakdown. At this point, the neckline acts as resistance. While this method offers a better risk-to-reward ratio, there is a chance you might miss the trade if the price does not retrace.
“The safest approach is to wait for a confirmed breakdown of the ‘M’ formation, marked by a candle closing below the neckline.” – Lee Yang, Market Analyst
Once you have decided on your entry method, it is crucial to set clear profit and stop-loss levels to manage your trade effectively.
Profit and Loss Levels
Defining profit targets and stop-loss levels is key to controlling risk and maximising returns.
Profit targets are calculated based on the pattern’s height:
| Measurement | Calculation Method | Application |
|---|---|---|
| Pattern Height | Distance between tops and neckline | Projected downward from the breakdown |
| Take-Profit Zone | Equal to pattern height | Measured from the breakdown point |
| Risk-Reward Ratio | Minimum 1:3 recommended | Ratio of stop-loss to profit target |
Use technical indicators and volume analysis to confirm both your entry and exit points.
Stop-Loss Placement
Your stop-loss should be set above the neckline resistance. Consider these guidelines:
- Place it just above the neckline resistance level.
- Ensure it aligns with your risk tolerance.
- Set it at least one-third of the distance to your take-profit target.
This approach helps balance risk while giving trades room to develop.
Managing Trade Risk
Position-Size Control
Manage your position size by risking a fixed percentage of your capital. Adjust this percentage based on factors like stop-loss distance, market volatility, and the specifics of the trading pattern. Once you have calculated your position size, focus on setting up a risk-reward ratio that supports consistent performance.
Risk-Reward Setup
Strive for a risk-reward ratio of at least 1:2. If possible, aim for 1:3, as it can significantly improve your returns over time.
Stop-Loss Placement Strategy
For tighter risk control, consider placing stop-losses near minor swing points after the second top. This approach offers two key advantages:
- A better win-loss ratio (targeting around 1.8:1) due to closer stop placement
- Clear pattern invalidation if the price moves beyond the midpoint between the second top and the signal line
Here are some stop-loss execution options to consider:
| Order Type | Pros | Cons |
|---|---|---|
| Stop Market | Guarantees execution | May lead to slippage |
| Stop Limit | Controls entry price | Could fail to execute in high volatility |
Common Trading Errors
Early Entry Mistakes
Jumping into short positions too soon, before a double top pattern is fully formed, can lead to unnecessary losses. To avoid this, wait for a clear neckline break accompanied by strong volume and a series of downward candles. These factors confirm the pattern and reduce the risk of premature entries.
Also, double-check for any overlooked confirmation signals before committing to your trade.
Missing Key Signals
Overlooking critical signals is another frequent issue when trading double top patterns.
“The two tops are not as important as the trough between them. This serves as the threshold that signals whether a trend reversal is occurring.” – FXOpen
Key confirmations to prioritise include:
| Signal Type | Additional Check |
|---|---|
| Momentum | Look for bearish divergence across multiple timeframes |
| Pattern Structure | Ensure the peaks are clearly separated by a defined trough |
Stop-Loss Mistakes
Placing stop-loss orders incorrectly can turn a solid trade into a loss. Here are some common errors to avoid:
- Place your stop-loss above the neckline to accommodate market fluctuations.
- Adjust your position size based on the distance to your stop-loss to maintain proper risk management.
Summary
This section highlights the essential steps for trading double top breakdowns, emphasising pattern recognition, confirmation signals, and effective risk management. Here is what you need to focus on:
To trade double top breakdowns, ensure you identify the pattern accurately, confirm it with strong signals, and manage your risk wisely. Look for a clear neckline break and strong volume to validate the setup. You can explore automated testing of these ideas inside the AI Backtesting Assistant docs.
“A double top is only valid when the price breaks and a candle closes below the neckline. By waiting for a confirmation of the pattern, you improve your chances of trading a double top successfully.” – Lee Yang, Market Analyst
Key elements for executing trades include:
| Component | Key Requirements | Risk Controls |
|---|---|---|
| Pattern Structure | Two clear peaks at the same price level | Wait for the pattern to fully form |
| Entry Confirmation | Candle closes below the neckline | Use volume analysis and technical indicators |
| Risk Management | Stop-loss above the second peak | Adjust position size based on risk tolerance |
Setting clear profit and stop-loss levels is critical. For instance, if a double top forms at 1.2000 with a neckline at 1.1800, this could indicate a potential 200-pip move to 1.1600.
Patience and discipline are key. Watch for bearish divergence in momentum and stick to your stop-loss levels. The pattern’s success rate improves when paired with other technical tools such as RSI, MFI, or ADX.
For even better results, validate patterns across multiple timeframes and ensure your risk-reward ratio matches your trading strategy. LuxAlgo’s Market Structure Shift module in the PAC Toolkit automatically spots nested double top formations, adding an extra layer of confidence to your analysis.
FAQs
How can I confirm a double top pattern and its breakdown?
To confirm a double top pattern and its breakdown, look for a decisive break below the neckline, typically validated by a candlestick closing beneath it. Additional confirmation may come from bearish divergence on indicators such as the RSI, where price forms higher highs but the RSI shows lower highs.
Other tools to strengthen the signal include volume analysis, a noticeable increase in volume during the breakdown suggests stronger selling pressure. Momentum indicators and moving averages can also help validate the reversal, ensuring the pattern is not a false breakout.
What are the best ways to manage risk when trading a double top breakdown?
To manage risk effectively when trading a double top breakdown, start by waiting for confirmation of the pattern. This typically means ensuring that the price closes below the neckline of the M formation before entering a short position. Acting too early can lead to false signals.
Using a stop-loss order is essential for limiting potential losses. Place the stop-loss above the recent swing high or near the second peak of the double top. This ensures your downside is controlled if the trade moves against you.
For profit-taking, consider setting take-profit levels near key support zones or slightly above the measured move target of the pattern. Combining the double top analysis with other tools such as trendlines or volume indicators can further improve accuracy and help you make more informed decisions.
Why should traders use higher timeframes to identify double top patterns?
Using higher timeframes to identify double top patterns is recommended because it provides a clearer and more reliable view of market trends. Higher timeframes help filter out short-term price fluctuations or noise, making it easier to confirm the pattern’s formation and breakdown.
Additionally, double tops identified on higher timeframes, such as daily or weekly charts, tend to signal stronger and more significant market reversals. This can lead to better trading opportunities for short-selling while reducing the likelihood of false signals. For traders, this approach also allows more time to plan entries, exits, and risk management strategies effectively.
References
- Oscillator Matrix Reversal Signals
- LuxAlgo Blog, Double Tops and Bottoms
- Volumetric Toolkit
- Candlestick Structure Indicator
- Signals and Overlays, Candle Coloring
- Liquidation Levels Indicator
- PAC Backtester TP and SL Guide
- OSC Toolkit Reversal Signals (alt URL)
- S and O Backtester TP and SL Guide
- Breakouts with Tests and Retests
- AI Backtesting Platform
- AI Backtesting Assistant Docs
- Ichimoku Theories Indicator
- Ultimate RSI Indicator
- PAC Market Structures


