Twelve Candlestick Patterns Every Trader Must Know
Candlestick patterns summarize price behavior through the open, high, low and close. Learning their anatomy helps you distinguish potential reversals, continuation setups and indecision. A recognizable shape is a starting point for analysis, not a complete trading strategy.
This guide covers twelve patterns and formations, including familiar Hammers and Engulfings, three-candle Stars and less common continuation sequences. Use LuxAlgo’s charting and AI platform to inspect them on Quant Charts and work with Quant, our coding agent, to turn a specific idea into rules you can review and test.
Read the Candle Before Naming the Pattern
The real body spans the open and close. The upper shadow extends from the higher of those prices to the high; the lower shadow extends from the lower to the low. Color shows whether the close was above or below the open, according to your chart’s settings. Traditional references often use white for bullish bodies and black for bearish bodies; modern charts commonly use green and red.
A candle does not show the full sequence of trades inside its interval. Nor does it reveal every participant’s motives. Read its location relative to the preceding trend, support and resistance, and evaluate only completed bars when the rule requires a close.
Twelve Patterns at a Glance
| Pattern | Typical context | Core distinction |
|---|---|---|
| 1. Hammer | Potential bullish reversal after a decline | Small upper body and long lower shadow |
| 2. Morning Star | Potential bullish reversal after a decline | Three candles; recovery into the first body |
| 3. Bullish Engulfing | Potential bullish reversal after a decline | Second real body covers the first |
| 4. Piercing Pattern | Potential bullish reversal after a decline | Bullish close above the first body’s midpoint |
| 5. Shooting Star | Potential bearish reversal after an advance | Small lower body and long upper shadow |
| 6. Evening Star | Potential bearish reversal after an advance | Three candles; decline into the first body |
| 7. Dark Cloud Cover | Potential bearish reversal after an advance | Bearish close below the first body’s midpoint |
| 8. Doji | Indecision interpreted in context | Open and close are equal or nearly equal |
| 9. Rising Three Methods | Potential bullish continuation | Contained pause followed by upward resumption |
| 10. Falling Three Methods | Potential bearish continuation | Contained pause followed by downward resumption |
| 11. Concealing Baby Swallow | Classical bullish reversal in a decline | Rare four-candle bearish sequence |
| 12. Separating Lines | Potential trend continuation | Opposite-colored bodies with matching opens |
These are categories to learn, not a ranking by win rate. The StockCharts candlestick dictionary provides the standard anatomy for the common patterns. Gap rules, equal-price tolerances and body-size thresholds should be stated explicitly when testing a detector.
Bullish Reversal Patterns
A bullish reversal interpretation requires a preceding decline. The same body relationship at new highs may describe continued buying instead. A support area can supply context, but it does not guarantee that the next move will be upward.
1. Hammer
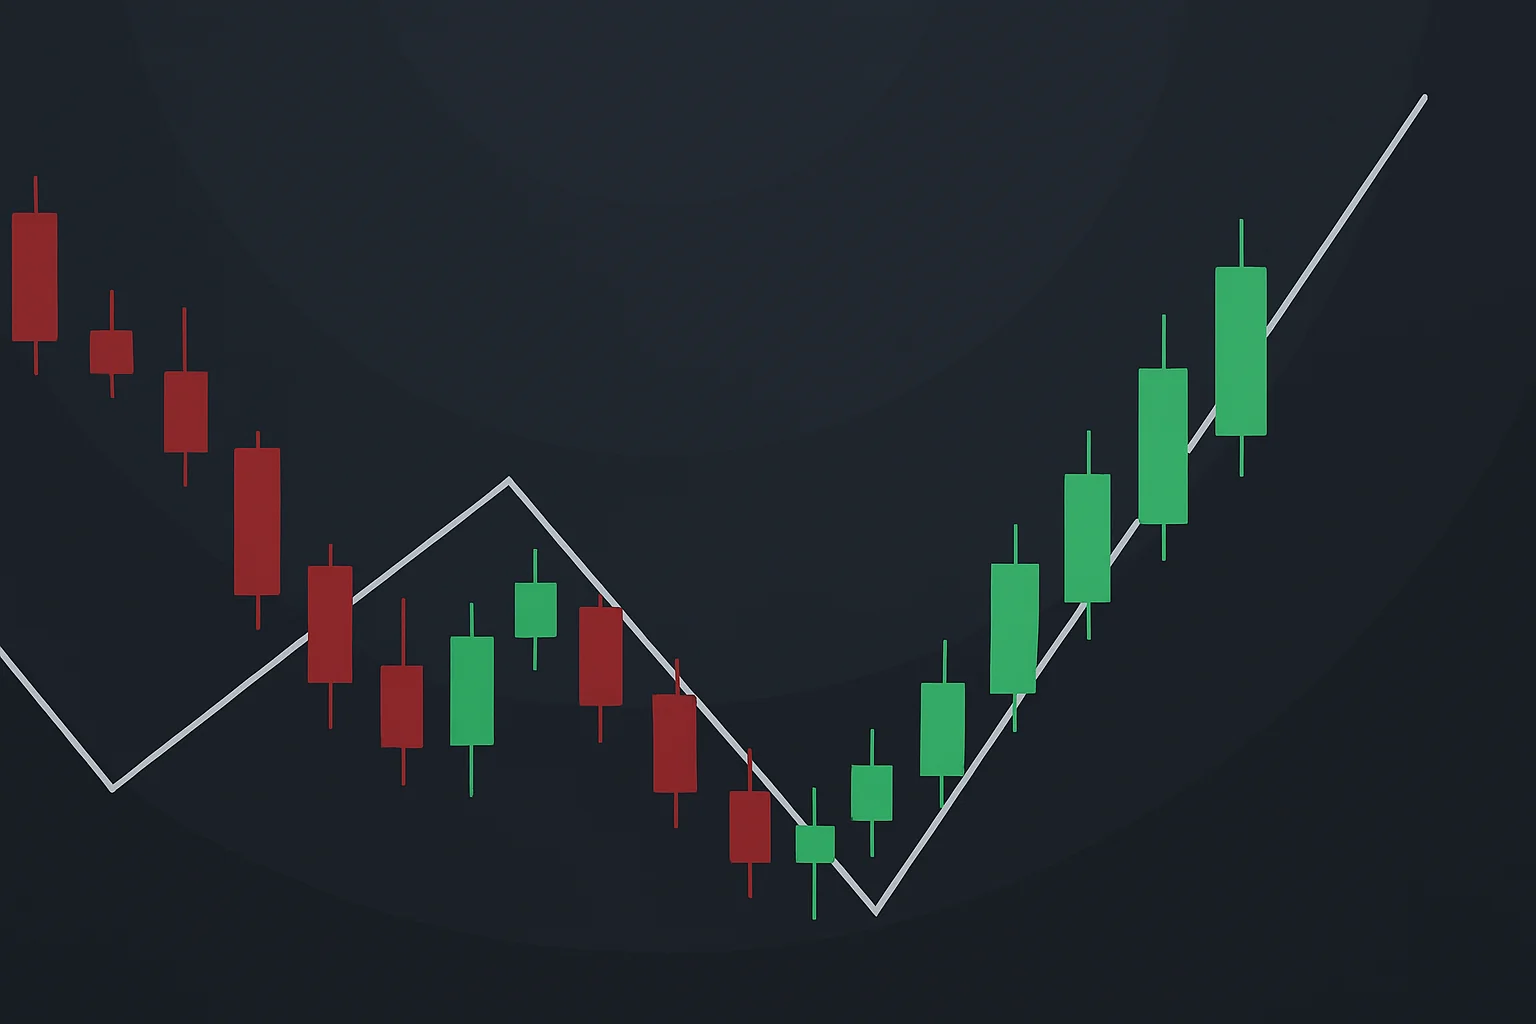
A Hammer has a small real body near the top of its range, little or no upper shadow and a lower shadow commonly at least twice the body’s length. After a decline, it records a move lower that recovered within the candle. Either body color can qualify.
The same general shape after an advance is called a Hanging Man. A later break above the Hammer’s high can be an entry condition, but a gap up or volume spike is not mandatory in every definition. A stop based on the formation normally considers its low and a predefined execution buffer.
2. Morning Star
A Morning Star has a large bearish first body, a small middle body and a bullish third candle closing above the midpoint of the first real body. A doji in the middle makes it a Morning Doji Star variation; a doji is not required for the ordinary Morning Star.
Classic definitions include gaps around the star position. In continuous markets, a gap-relaxed version should be identified as a variation. Wait for the third candle to close before deciding whether it recovered far enough into the first body.
3. Bullish Engulfing
A bearish real body is followed by a bullish body that covers it. Engulfing compares the open-to-close bodies, not necessarily the entire high-to-low ranges. The first candle’s wick can still extend beyond the second candle.
Define how equal opens or closes are handled. If your stop is outside the whole two-candle pattern, use the lower low of both candles. Buying above the second high, entering on the next bar and waiting for a pullback are different execution rules.
4. Piercing Pattern
A Piercing Pattern starts with a substantial bearish candle during a decline. The next candle opens lower and recovers above the midpoint of the first body, typically finishing below that first candle’s open. A fuller body takeover may instead satisfy an engulfing definition.
References differ in whether the lower open must be below the prior close or the prior low. Keep that gap convention fixed in a test. The recovery is a potential reversal signal, and any additional follow-through requirement must also be explicit.
Bearish Reversal Patterns
Bearish reversal patterns follow an advance. Resistance, momentum and volume may add context, but a red candle after a rally can also be a temporary pullback. Short-trade rules need their own execution, borrowing and risk assumptions.
5. Shooting Star
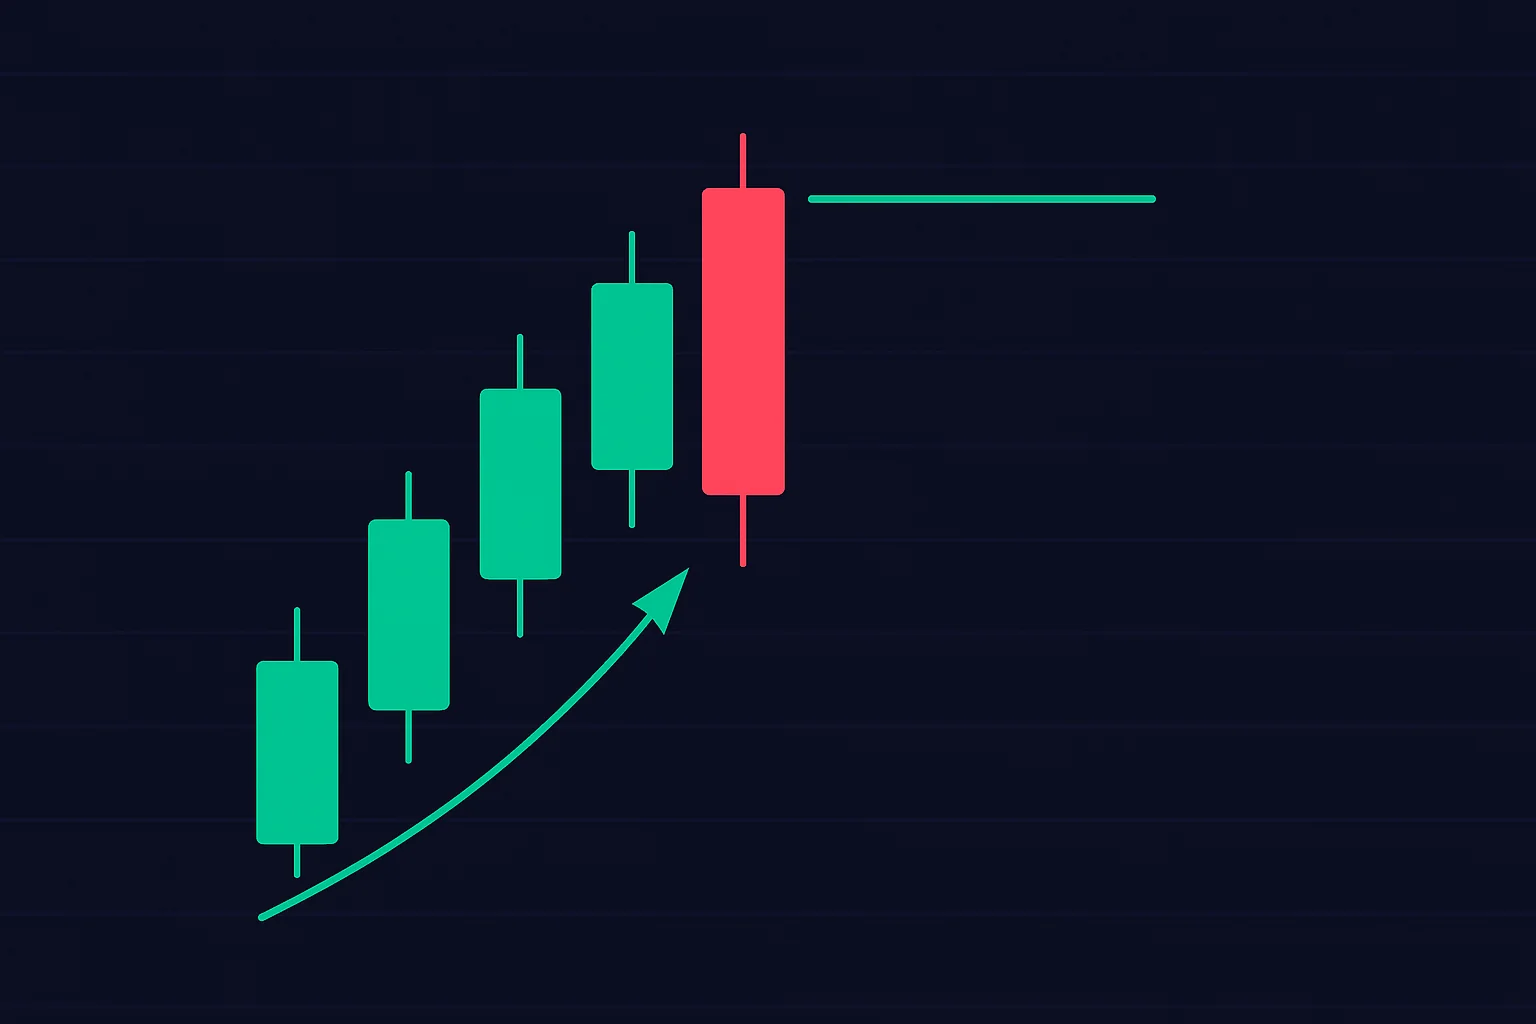
A Shooting Star has a small body near the bottom of the range, little or no lower shadow and a long upper shadow, commonly at least twice the body. It appears after an advance and records rejection of higher prices within that candle.
Body color is not the defining feature. The similar shape after a decline is an Inverted Hammer. A candidate short rule could require a later break below the completed candle’s low, with initial invalidation above its high.
6. Evening Star
An Evening Star is the bearish counterpart to the Morning Star: a substantial bullish body, a small middle body and a bearish third candle closing below the midpoint of the first real body. The middle candle need not be a doji.
Being above a 20-day EMA is a possible trend filter, not an inherent requirement of every Evening Star. State gap and follow-through conditions separately. A stop outside the formation must consider the highest high of all three candles.
7. Dark Cloud Cover
After an advance, a bullish first candle is followed by a candle that opens higher and closes below the midpoint of the first body. The classic gap convention uses an open above the preceding high. A close that fully covers the first body can instead form a bearish engulfing pattern.
Compare the close with the body midpoint, not the midpoint of the entire wick range. The pattern can suggest a change in near-term behavior, but it does not guarantee that resistance will hold.
8. Doji: Indecision Needs Context
A Doji forms when the open and close are equal or nearly equal. The shadows can be long, short or uneven. A strict equality rule finds fewer examples than a tolerance based on ticks or a fraction of the candle’s range.
A Doji is not automatically bullish or bearish. After a large advance it may prompt a review of momentum; inside a quiet range it may simply reflect little net movement. A subsequent breakout or a larger multi-candle formation supplies a separate condition to evaluate.
Continuation Patterns
9. Rising Three Methods
The classic five-candle formation begins with a long bullish candle in an uptrend. Three smaller countertrend candles stay within the first candle’s high-to-low range, followed by a strong bullish fifth candle that resumes the move and closes at a new high for the sequence.
The middle candles describe a contained pause. The fifth candle completes the pattern; it is not proof that every later bar will continue upward. Define the body-size comparisons and whether you require a close above the first high or another precise boundary.
10. Falling Three Methods
This is the bearish mirror: a long bearish candle, three smaller countertrend candles contained within its range, then a bearish fifth candle closing at a new low for the sequence. It is conventionally a continuation pattern in a decline.
Use the same containment and size conventions when comparing the bullish and bearish versions. A pause that breaks the initial range may belong to another setup and should not be relabeled after a favorable outcome.
Two Less Common Formations
11. Concealing Baby Swallow
Concealing Baby Swallow is conventionally a bullish reversal formation during a decline, despite comprising four bearish candles. Its classical sequence involves two bearish marubozu-like candles, a lower-opening third candle with an upper shadow reaching into the preceding body, and a fourth bearish candle that covers the third candle and its shadow.
It is not a generic bearish continuation signal. The strict gap, body and shadow requirements can make it rare, leaving limited observations for a performance estimate. Rarity does not establish reliability. LuxAlgo’s Rare Candlestick Formations study classifies it among bullish reversals and provides explicit detection settings.
12. Separating Lines
Separating Lines consist of opposite-colored bodies opening at the same or approximately the same price. In the bullish version, a bearish candle interrupts an uptrend and is followed by a bullish candle opening back near the prior open. The bearish version reverses the colors in a downtrend.
The matching-open relationship matters: “near the bottom of the first candle” is not a sufficient general definition. Set an equality tolerance appropriate to the instrument. LuxAlgo’s rare-pattern study treats these as continuation formations aligned with the prior trend.
Historical Examples: Context, Not Performance Proof
The StockCharts bullish reversal guide illustrates two Bullish Engulfings in Sun Microsystems in January 2000. The first was followed by a confirming gap and an advance into the mid-$40s. These are selected examples of the sequence, not a complete trading-results sample.
The same guide shows Ciena falling from above $80 to around $40 in late March and early April 2000. A mid-April Piercing Pattern at the retest was followed by an advance above $50, then a setback before a later rise above $70. Including the setback is important: confirmation did not mean a straight-line move.
The bearish reversal guide shows RadioShack testing resistance near $70 in early October 2000. Dark Cloud Cover, weakening momentum and weak money flow accompanied the setup; a sharp decline followed the next day. The prices belong to those historical chart examples.
A pennant, such as a consolidation studied during a TSLA advance, is a broader chart pattern rather than one of these candle formations. Keep its trendline and breakout rules separate from Rising Three Methods. An attractive historical rally alone does not validate either strategy.
Trading with Candlestick Patterns
Add Filters That Answer a Specific Question
| Tool | Question to investigate | Limitation |
|---|---|---|
| 50- or 200-period moving average | Is price above or below a defined trend reference? | A lagging average does not confirm future direction |
| RSI or MACD | Does momentum agree or diverge? | Multiple momentum tools may repeat similar information |
| Volume or OBV | How does participation compare with a chosen baseline? | Feed coverage matters; volume can rise during failure |
| Fibonacci levels and support/resistance | Does the pattern occur near a predefined price area? | Levels chosen afterward introduce hindsight |
A rule requiring volume at least 1.5 times its prior 20-bar average is a testable filter, not a universal validation threshold. Use the same session and volume source for the comparison. Higher volume can accompany continuation, reversal or a failed move.
There is no universal one-to-two-week lifespan for all candle signals across timeframes, nor a supported rule that strong patterns are three times as likely to work. Define the holding period and expiry for the actual setup. Compare filtered and unfiltered results after costs before claiming improvement.
Build a Trading Plan
- Define the pattern’s body, shadow, gap and preceding-trend conditions.
- Wait for all required candles and higher-timeframe inputs to be confirmed.
- Specify the entry order, trigger and expiry.
- Choose the initial invalidation and target before entry.
- Calculate size from the actual risk distance and account constraints.
- Record results, costs and skipped setups consistently.
For a hypothetical long, assume a $50 entry, $48 stop and $54 target. Initial risk is $2 per share and potential reward is $4, or 2R before costs. With a $10,000 account and an illustrative 0.5% risk budget, $50 ÷ $2 allows 25 shares, worth $1,250. A gap exit at $47 would lose $75 before costs rather than the planned $50. The percentage is an example, not a universal risk recommendation.
Pattern Analysis Mistakes
Common errors include naming a reversal without a preceding trend, entering before the final close, mixing body and wick definitions, and testing with future-confirmed pivots. Over-trading every detection also increases costs and correlated exposure.
Higher timeframes show different information, not guaranteed higher accuracy. Decide how the trend interval and entry interval interact, and use only information available at the decision time. Keep losing examples in your journal rather than saving only clean textbook charts.
Study and Test Candles with LuxAlgo
Review Actual Prices on Quant Charts
Use Quant Charts to inspect candle anatomy, compare intervals and add relevant studies. Ordinary price candles are the appropriate starting point for these definitions. Heikin Ashi and other transformed displays change the values and shapes, so they are different inputs.
Choose the Right Candlestick Study
Candlestick Structure recognizes sixteen formations and filters them against a major-trend method: Supertrend, EMAs, ChoCh or Donchian Channel. Its alignment dashboard describes how often detections matched the selected trend. It is not a confidence score or a strategy win rate, and its coverage is not identical to the twelve entries in this article.
Rare Candlestick Formations covers less common sequences, including Concealing Baby Swallow and Separating Lines. It provides prior-trend, body, shadow and price-match settings. Its optional confirmation-close setting changes when a signal qualifies; the occurrence dashboard counts detections rather than profitable trades.
Turn a Pattern into Testable Rules with Quant
Use Quant, our coding agent, to help implement one precise hypothesis. Specify the pattern, trend filter, entry timing, position sizing, stop, target and costs. Require a fixed definition for equal prices and for a long or small body.
Follow Making Strategies with Quant: inspect the generated code and click Run yourself. Use the native backtest guide to review individual trades and execution assumptions. Check next-bar entries, gaps and bars touching both stop and target. Successful code execution is not proof of correct trading logic.
Compare a manageable number of variations, keep an untouched test period and include realistic costs. Quant does not turn a pattern label or dashboard percentage into a guarantee of future returns.
What to Practice First
Learn the open, close and shadow relationships before memorizing names. Then practice distinguishing a potential reversal from continuation and indecision in the preceding trend. Use Quant Charts for visual review and Quant for explicit strategy testing, keeping the original observations separate from the measured results.
FAQs
How can I combine candlestick patterns with technical indicators?
Use each indicator as a clearly defined filter, such as price above a moving average or an RSI condition. Compare the filtered setup with the original rules after costs. More indicators do not automatically provide independent confirmation.
What are common candlestick analysis mistakes?
Entering before candle completion, confusing bodies with wicks, ignoring the preceding trend and using hindsight are common errors. Define the pattern, entry, stop and expiry before examining the outcome.
Does high volume confirm a candlestick pattern?
It adds context about participation but does not prove the next price direction. A fixed threshold such as 1.5 times average volume is a rule to test, not a universal guarantee. Check the feed and session used.
Does a Morning or Evening Star require a doji?
No. The ordinary Star uses a small middle body. A doji creates the Morning Doji Star or Evening Doji Star variation. The third candle must satisfy the relevant recovery or decline condition.
Is Concealing Baby Swallow bearish continuation?
Its conventional classification is bullish reversal after a decline, despite its four bearish candles. It is rare, and its classical label does not establish a reliable trading win rate.
Is Candlestick Structure alignment a win rate?
No. Alignment describes the relationship between pattern detections and the selected trend method. A strategy win rate requires defined entries, exits, fills and costs.
References
LuxAlgo Resources
- Quant Charts
- LuxAlgo Quant
- Making Strategies with Quant
- Native Backtest Guide
- Candlestick Structure
- Rare Candlestick Formations
- Rare Candlestick Formations Concept Guide
- LuxAlgo Pricing
External Resources
Read next