
Explore how Finviz simplifies stock market analysis with powerful screening, visualization tools, and technical indicators for traders of all levels.
Finviz is a platform that simplifies stock market analysis for traders and investors. It offers tools to screen over 8,500 stocks and ETFs using 67 filters and criteria. Whether you're a day trader, swing trader, or long-term investor, Finviz provides features tailored to your needs.
Key Features:
- Free vs. Elite Versions:
- Free: Delayed data, basic charts, no portfolios.
- Elite ($39.50/month): Real-time data, advanced charts, up to 500 portfolios, and data export.
- Stock Screening: Filters for market cap, P/E ratios, RSI, and more.
- Visualization Tools: Heatmaps and charts for trend analysis.
- Technical Analysis: Over 100 indicators, pattern recognition, and 24 years of historical data.
- Alerts: Price, news, and rating updates for Elite users.
- Data Export: Available for Elite users to integrate into other tools.
Quick Comparison:
| Feature | Free Version | Elite Version |
|---|---|---|
| Data Delivery | Delayed | Real-time |
| Charts | Basic | Advanced + Intraday |
| Portfolios | None | Up to 500 |
| Data Export | No | Yes |
| Advertisements | Yes | Ad-free |
Finviz is a versatile platform for traders at all levels, with advanced features available in its Elite plan for those needing real-time data and deeper analysis.
Find The Best Stocks To Trade: 3 Scans Setups From Finviz
Stock Screening Tools
Finviz offers intuitive screening filters that help traders narrow down stocks based on various criteria. These filters combine ease of use with advanced features, making them a go-to resource for both beginners and experienced traders. They also serve as a starting point for further analysis using Finviz’s charting and pattern-recognition capabilities.
Screen Interface Guide
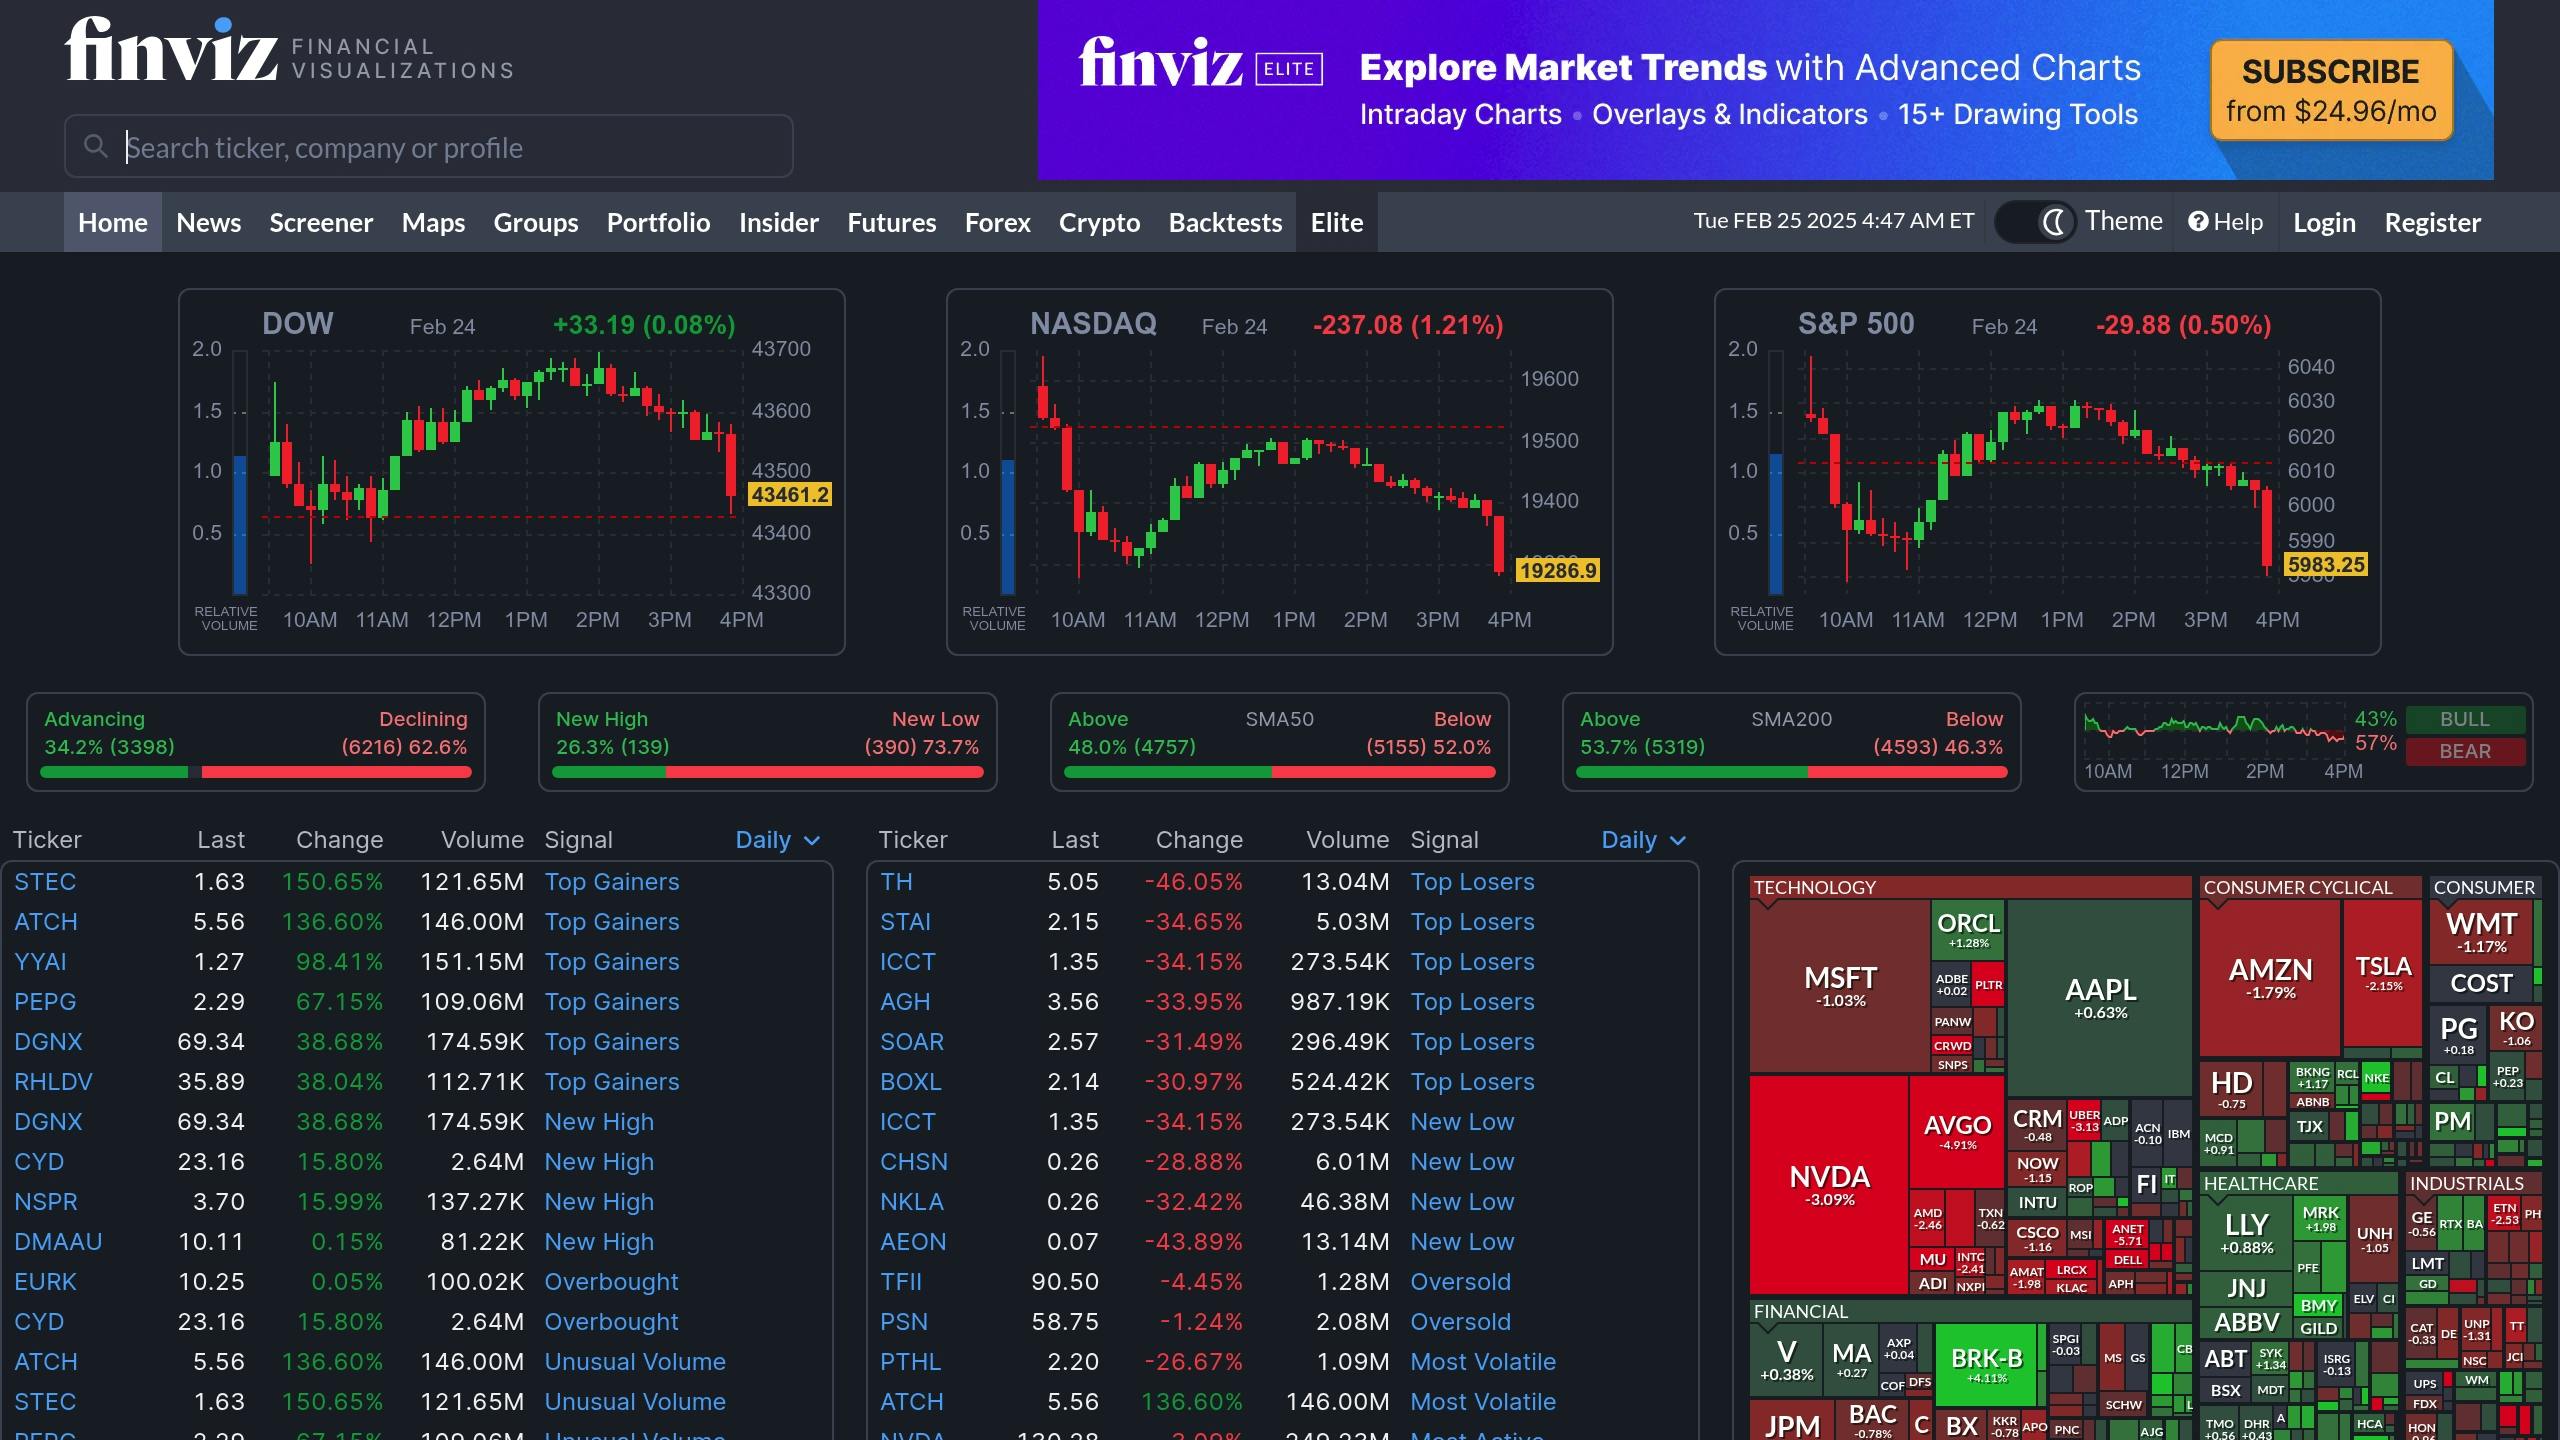
The screening interface is divided into three main filter categories: Descriptive, Fundamental, and Technical. These filters, accessible through the top navigation bar, allow users to instantly update results in chart, metrics, or technical views. The interface is designed to display filters alongside a customizable grid, which provides options to view stocks by overview, valuation, or technical details.
Filter Categories: Basic and Advanced
The filters are grouped into the following categories:
- Descriptive: Includes criteria like market cap and trading volume.
- Fundamental: Covers metrics such as P/E ratios, profit margins, and debt levels.
- Technical: Focuses on indicators like moving averages, RSI, and candlestick patterns. Elite users also get access to custom candlestick configurations.
This flexibility allows traders to tailor their searches to match specific strategies or goals.
Managing Custom Screens
Traders can save their filter settings as presets, making it easier to revisit and reuse specific screening combinations. To build an effective custom screen, start with broader filters, such as sector or market cap, and then refine the search with more specific criteria. For example, a momentum strategy could focus on stocks with:
- Volume above 500,000
- Price trading above the 20-day moving average
- Positive EPS growth
Elite subscribers also have the option to export their screening results for further analysis in other platforms, which can assist with more in-depth research and backtesting.
Market Visualization Features
Finviz builds on its screening tools with powerful visualization features to help users understand market and sector trends. One standout feature is the heatmap, which provides a quick, color-coded snapshot of market movements and sector performance.
Heatmap and Sector Analysis
The heatmap delivers a visual summary of the stock market, highlighting which sectors are thriving and which are lagging. This tool offers a broad perspective, making it easier to identify trends before diving into Finviz’s detailed charting features.
Charts and Pattern Tools
Finviz’s charting features combine technical analysis with pattern recognition, making it easier to pinpoint trading opportunities. For Elite subscribers, the platform includes advanced options like:
- Real-time intraday charts
- 100+ technical indicators
- 24 years of historical data
- Drawing tools for custom analysis
- Performance comparison charts
The platform supports a variety of chart patterns, including:
- Basic patterns: double tops/bottoms, head & shoulders, triangles, and channel formations.
- Advanced tools: customizable candlestick charts, multi-timeframe analysis, and overlay options.
You can also combine indicators like moving averages and RSI, while leveraging different timeframes—daily charts to gauge trends and hourly charts for precise entries—to refine your strategies.
Technical Analysis Tools
Finviz goes beyond simple screening and visualization by offering features that help traders dive deeper into chart analysis. With layered chart indicators and automated pattern recognition, you can fine-tune entry and exit strategies for better decision-making.
Chart Indicator Setup
Finviz allows users to customize charts by adding multiple technical indicators. For those with Elite subscriptions, the platform provides access to over 100 indicators, real-time market data, and decades of historical price information—perfect for backtesting strategies.
To enhance your analysis, combine trend indicators like moving averages with momentum tools such as RSI to assess trend strength. The "Technical" tab offers filters like "Change from Open" and "Candlestick" patterns, making it easy to spot specific setups.
Pattern Detection and Testing
Finviz also excels in pattern recognition, identifying numerous chart patterns. This feature is particularly useful for technical traders looking to capitalize on specific setups. Here’s a breakdown of some key patterns and how to approach them:
| Pattern Category | Key Patterns | Approach |
|---|---|---|
| Trend Patterns | Trendlines, Channels | Enter on breakouts with volume confirmation |
| Reversal Signals | Double Tops/Bottoms, Head & Shoulders | Trade breaks of support or resistance levels |
| Continuation Patterns | Triangles, Wedges | Focus on pattern completion with high volume |
"My Finviz testing uncovered an impressive free stock screener, speedy market heatmaps, and automated chart pattern recognition! Plus, with Finviz Elite, you gain access to real-time data, interactive charts, and backtesting—all at a competitive price." – Barry D. Moore
For example, a Price Rate of Change strategy tested on the platform delivered a 1,624% profit over 25 years, translating to an annual return of 12.68% compared to the S&P 500’s 10.44%.
To improve pattern detection results, keep these tips in mind:
- Entry Timing: For double tops, place sell orders below horizontal support breaks.
- Volume Confirmation: Ensure there’s a noticeable increase in volume when patterns complete.
- Performance Metrics: Prioritize strategies with Sharpe ratios above 1.0 to maintain consistency.
While Finviz’s free version has some limitations—such as restricted access to real-time quotes and advanced charting—Elite subscribers unlock the full suite of technical features for $39.50 per month.
Daily Trading Workflow
Build an efficient daily trading routine with Finviz’s screening tools, alerts, and data export options.
Alert Configuration
Finviz Elite allows users to set up various alerts to stay on top of market movements. Email alerts are triggered based on specific conditions, such as:
| Alert Type | Trigger Conditions | Use Case |
|---|---|---|
| Price Alerts | Support/resistance breaks, % changes | Spot breakout opportunities |
| News Alerts | Company announcements, SEC filings | Respond to impactful news events |
| Rating Changes | Analyst upgrades/downgrades | Track shifts in market sentiment |
| Screen Alerts | Matches custom screening criteria | Discover new trading setups |
These alerts help you stay informed about critical market changes. Once alerts are active, use technical analysis to confirm your trading decisions.
Integration with LuxAlgo
First, use Finviz to narrow down potential trades. Then, validate those trades using LuxAlgo’s Price Action Concepts and Signals & Overlays toolkits on TradingView. These toolkits provide automated price action levels, volume insights, and advanced overlays to ensure a comprehensive analysis before entering a position.
Data Export Methods
Export Finviz data to Excel to track key metrics and maintain an up-to-date trading log. This ensures your analysis is consistent and ready before the market opens.
"All the data in the spreadsheet can be saved and manipulated to develop your own stock screening spreadsheets. The stock quotes only need to be updated once a day (or whenever you require updated data)."
Elite users benefit from unlimited access to data export and real-time quotes, making it simple to integrate Finviz data into personalized analysis tools and spreadsheets. Update your records daily to stay prepared for the trading day ahead.
Conclusion
Platform Features and Advantages
Finviz scans over 8,500 securities using 67 criteria and includes visual tools like heatmaps, making it a go-to platform for short- to medium-term strategies. Its combination of speed and easy-to-understand visuals allows traders to quickly identify opportunities.
Here’s a breakdown of some standout features:
| Feature | What It Offers | How It Helps |
|---|---|---|
| Visual Screening | Simplifies market trend analysis | Tracks sector shifts and overall market momentum |
| News Aggregation | Centralizes news sources | Helps traders make informed decisions efficiently |
| Technical Tools | 17 indicators and 9 overlays | Confirms trading setups with multiple validations |
Steps to Get Started
- Explore the free version to get comfortable with basic screening filters like price, volume, and market cap.
- Upgrade to Elite for $39.50 per month if you need real-time data and advanced filtering options.
- Incorporate Finviz into your workflow, using its screening, charting, and alert features to validate your strategies consistently.


