Learn about Harami and Harami Cross patterns, their significance in trend reversal analysis, and effective trading strategies for optimal results.
- What They Are: Harami and Harami Cross are two-candlestick patterns used in technical analysis to signal potential trend reversals.
- Key Difference: A Harami includes a small candle within a larger one, while a Harami Cross features a Doji as the second candle, indicating stronger market indecision.
- Bullish vs. Bearish:
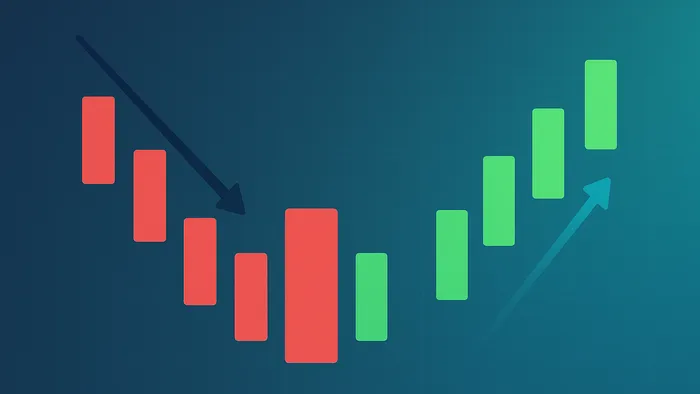
- Bullish Harami: Forms after a down-trend, suggesting a possible upward reversal.
- Bearish Harami: Appears after an up-trend, signalling potential downward movement.
- Reliability: Harami Cross patterns are generally more reliable because the Doji strengthens the reversal signal.
- Usage: Best combined with indicators like RSI, MACD, or Bollinger Bands for confirmation.
Quick Comparison
| Feature | Harami | Harami Cross |
|---|---|---|
| Second Candle | Small real body | Doji |
| Signal Strength | Moderate reversal indication | Stronger reversal potential |
| Reliability | Generally reliable | Enhanced by Doji’s signal |
Pro Tip: Use these patterns near key support/resistance levels and confirm signals with trading volume or other technical tools. Always manage risk with stop-loss orders and proper position sizing.
Trade the Harami Candlestick Pattern
Harami Pattern Structure
The Harami pattern is a two-candlestick formation often used to indicate a possible trend reversal. This formation provides a framework for spotting both bullish and bearish market signals.
Pattern Components
The pattern starts with a large candlestick that reflects strong market momentum. The second, smaller candlestick forms entirely within the body of the first one. While the smaller candle’s wicks might extend beyond the larger candle’s body, the contained real body suggests a possible change in market sentiment.
Bullish and Bearish Patterns
Harami patterns can be bullish or bearish, depending on the market context:
| Feature | Bullish Harami | Bearish Harami |
|---|---|---|
| Market Context | Appears after a down-trend | Appears after an up-trend |
| First Candle | Large red/black candlestick (downward momentum) | Large green/white candlestick (upward momentum) |
| Second Candle | Small green/white candlestick (upward momentum) | Small red/black candlestick (downward momentum) |
| Success Rate | 53 % chance of reversal | 47 % chance of reversal |
| Market Implication | Bears losing control | Bulls losing control |
“A Bullish Harami pattern is a highly recognizable market-reversal signal that experienced traders use to spot potential changes in trend direction.” – Alan Tsagaraev
Pattern Recognition Steps
- Confirm the trend: look for a down-trend for a bullish Harami or an up-trend for a bearish Harami.
- Identify a large candlestick that indicates strong momentum.
- Ensure the second candle’s body is fully contained within the first candle’s body.
- Check for increased trading volume on the second candle to strengthen the reversal signal.
For better reliability, pair Harami pattern analysis with other technical tools such as moving averages, RSI, or MACD. This combination provides a more comprehensive view of market conditions.
Harami Cross Analysis
The Harami Cross builds on the traditional Harami pattern by incorporating a Doji as the second candle, refining its ability to signal potential trend reversals.
Harami Cross Basics
This pattern consists of a large trend-following candlestick followed by a Doji that is fully contained within the first candle’s body. The Doji highlights market indecision.
| Component | Characteristics | Market Implication |
|---|---|---|
| First Candle | Large body aligned with the trend | Shows strong current momentum |
| Second Candle | Doji with nearly identical open and close | Indicates market indecision |
| Position | Doji entirely within the first candle’s body | Suggests potential trend exhaustion |
Pattern Differences
| Feature | Standard Harami | Harami Cross |
|---|---|---|
| Second Candle | Small real body | Doji formation |
| Reversal Signal | Moderate reversal indication | Stronger reversal potential |
| Reliability | Generally reliable | Enhanced by the Doji’s signal |
Doji Signal Analysis
“Regardless of the colour, the Doji candle shows indecision in the market, and if appearing near the top or bottom of a trend, it provides potential signs for the slowing or reversal of the current movement.” – CFI Team
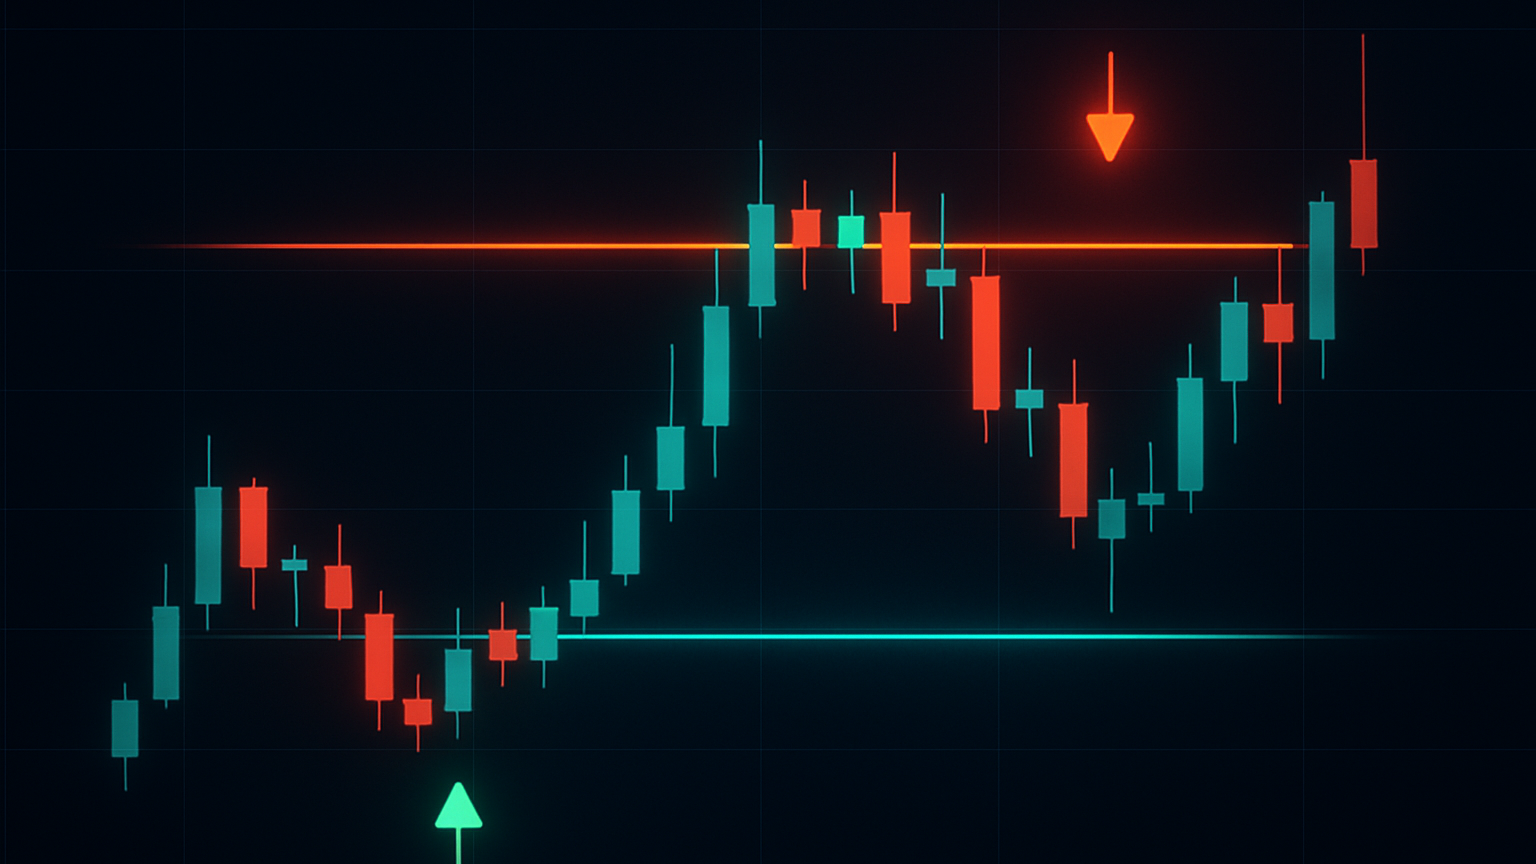
- Look for the pattern near key support or resistance levels.
- Confirm the signal with increased trading volume.
- Wait for additional price action to validate the reversal.
For example, in January 2021, CRISPR (CRSP) surged around 30 % in three days after a bullish Harami Cross signal (source: thetradinganalyst.com).


