

Explore how linear regression enhances trading strategies by identifying market trends, price forecasting, and integrating with other indicators.
Linear regression is a simple yet powerful approach for traders to analyze market trends and forecast price movements. It helps identify trends, support and resistance levels, and momentum by fitting a straight line through historical price data. Here's what you need to know:
- What it does: Shows market direction (bullish or bearish) using the slope of the regression line.
- How it's calculated: Based on price (y) and time (x) using the least-squares method.
- Key benefits: Enhances trend analysis, predicts price targets, and integrates with indicators like RSI and MACD.
- Advanced uses: Includes regression channels, mean reversion strategies, and AI-enhanced features for deeper insights.
Whether you're day trading or swing trading, linear regression provides a structured, data-driven approach to making informed decisions.
Linear Regression Basics and Calculations
Price and Time Variables
In financial market analysis, price is treated as the dependent variable (y), while time serves as the independent variable (x). The price refers to an asset's closing value, and time represents each trading interval. This relationship is the foundation for further calculations and market insights.
Calculation Methods
Once the variables are set, the regression line is calculated using the least-squares method. The linear regression line follows the equation:
y = α + βx
- α (y-intercept): The starting value of the line when x = 0.
- β (slope): Indicates how much y changes for a unit increase in x.
- x (time): Represents trading intervals.
- y (predicted price): The estimated closing price based on the regression.
To compute the slope (β), use the formula:
β = Σ((xi – x̄)(yi – ȳ)) / Σ((xi – x̄)²)
Here:
- xi and yi are individual time and price values.
- x̄ and ȳ are the averages of time and price values, respectively.
The y-intercept (α) is calculated as:
α = ȳ – (β * x̄)
| Component | Trading Application |
|---|---|
| Slope (β) | Shows the trend's direction and strength. |
| Y-intercept (α) | Reflects the baseline price level. |
| Time period (x) | Represents trading intervals (e.g., daily). |
| Price (y) | Reflects the asset's closing price. |
These calculations are essential for identifying trends and evaluating risks in trading strategies.
Accuracy Measurements
After defining the regression line, its effectiveness is assessed with R-squared and standard error metrics:
- R-squared: Measures how well the regression line matches actual price data. A value above 85% indicates a strong fit.
- Standard error: Reflects the average difference between actual prices and the regression line. Smaller values suggest more reliable predictions.
High R-squared values combined with low standard error indicate a dependable regression model for forecasting price movements.
Market Analysis with Linear Regression
Trend Analysis and Price Forecasting
Linear regression is a powerful method for spotting market trends. The Linear Regression Indicator (LRI) plots a line through the middle of price action, helping traders interpret market direction. A line with a positive slope suggests bullish conditions, while a negative slope indicates bearish sentiment. The steepness of the slope reveals the trend's strength. By extending this line, traders can estimate price targets based on the current momentum. Let’s look at how adding other indicators can sharpen these analyses.
Integration with Other Indicators
Pairing linear regression with other indicators can provide deeper insights. For example:
| Indicator | How It Helps |
|---|---|
| RSI | Validates overbought or oversold levels alongside regression trends |
| MACD | Confirms momentum for regression-based strategies |
| Bollinger Bands | Frames volatility around the regression line |
The Linear Regression Moving Average (LRMA) balances responsiveness to price changes with a smoother overall trend. However, large deviations from the LRMA can produce misleading signals, so it’s important to monitor extreme price movements carefully.
Trend Strength Indicators
To refine trading decisions, measuring the strength of a trend is key. The Linear Regression Slope (LRS) calculates momentum using this formula:
Slope = (N * Σ(xy) - Σx * Σy) / (N * Σ(x²) - (Σx)²)
Here, x represents time periods, y is the closing price, and N is the number of periods.
When prices cross the regression line, it often signals a trading opportunity. An upward cross suggests a buy signal, while a downward cross points to a sell signal. Adjust the regression period based on your trading approach: shorter periods (10–20 bars) work for day trading, while longer periods (50+ bars) suit swing trading.
Statistically, about 68% of price action stays within one standard deviation of the regression line, and roughly 95% falls within two standard deviations. This can help traders spot potential reversals when prices stray far from the mean.
Linear Regression Trading Methods
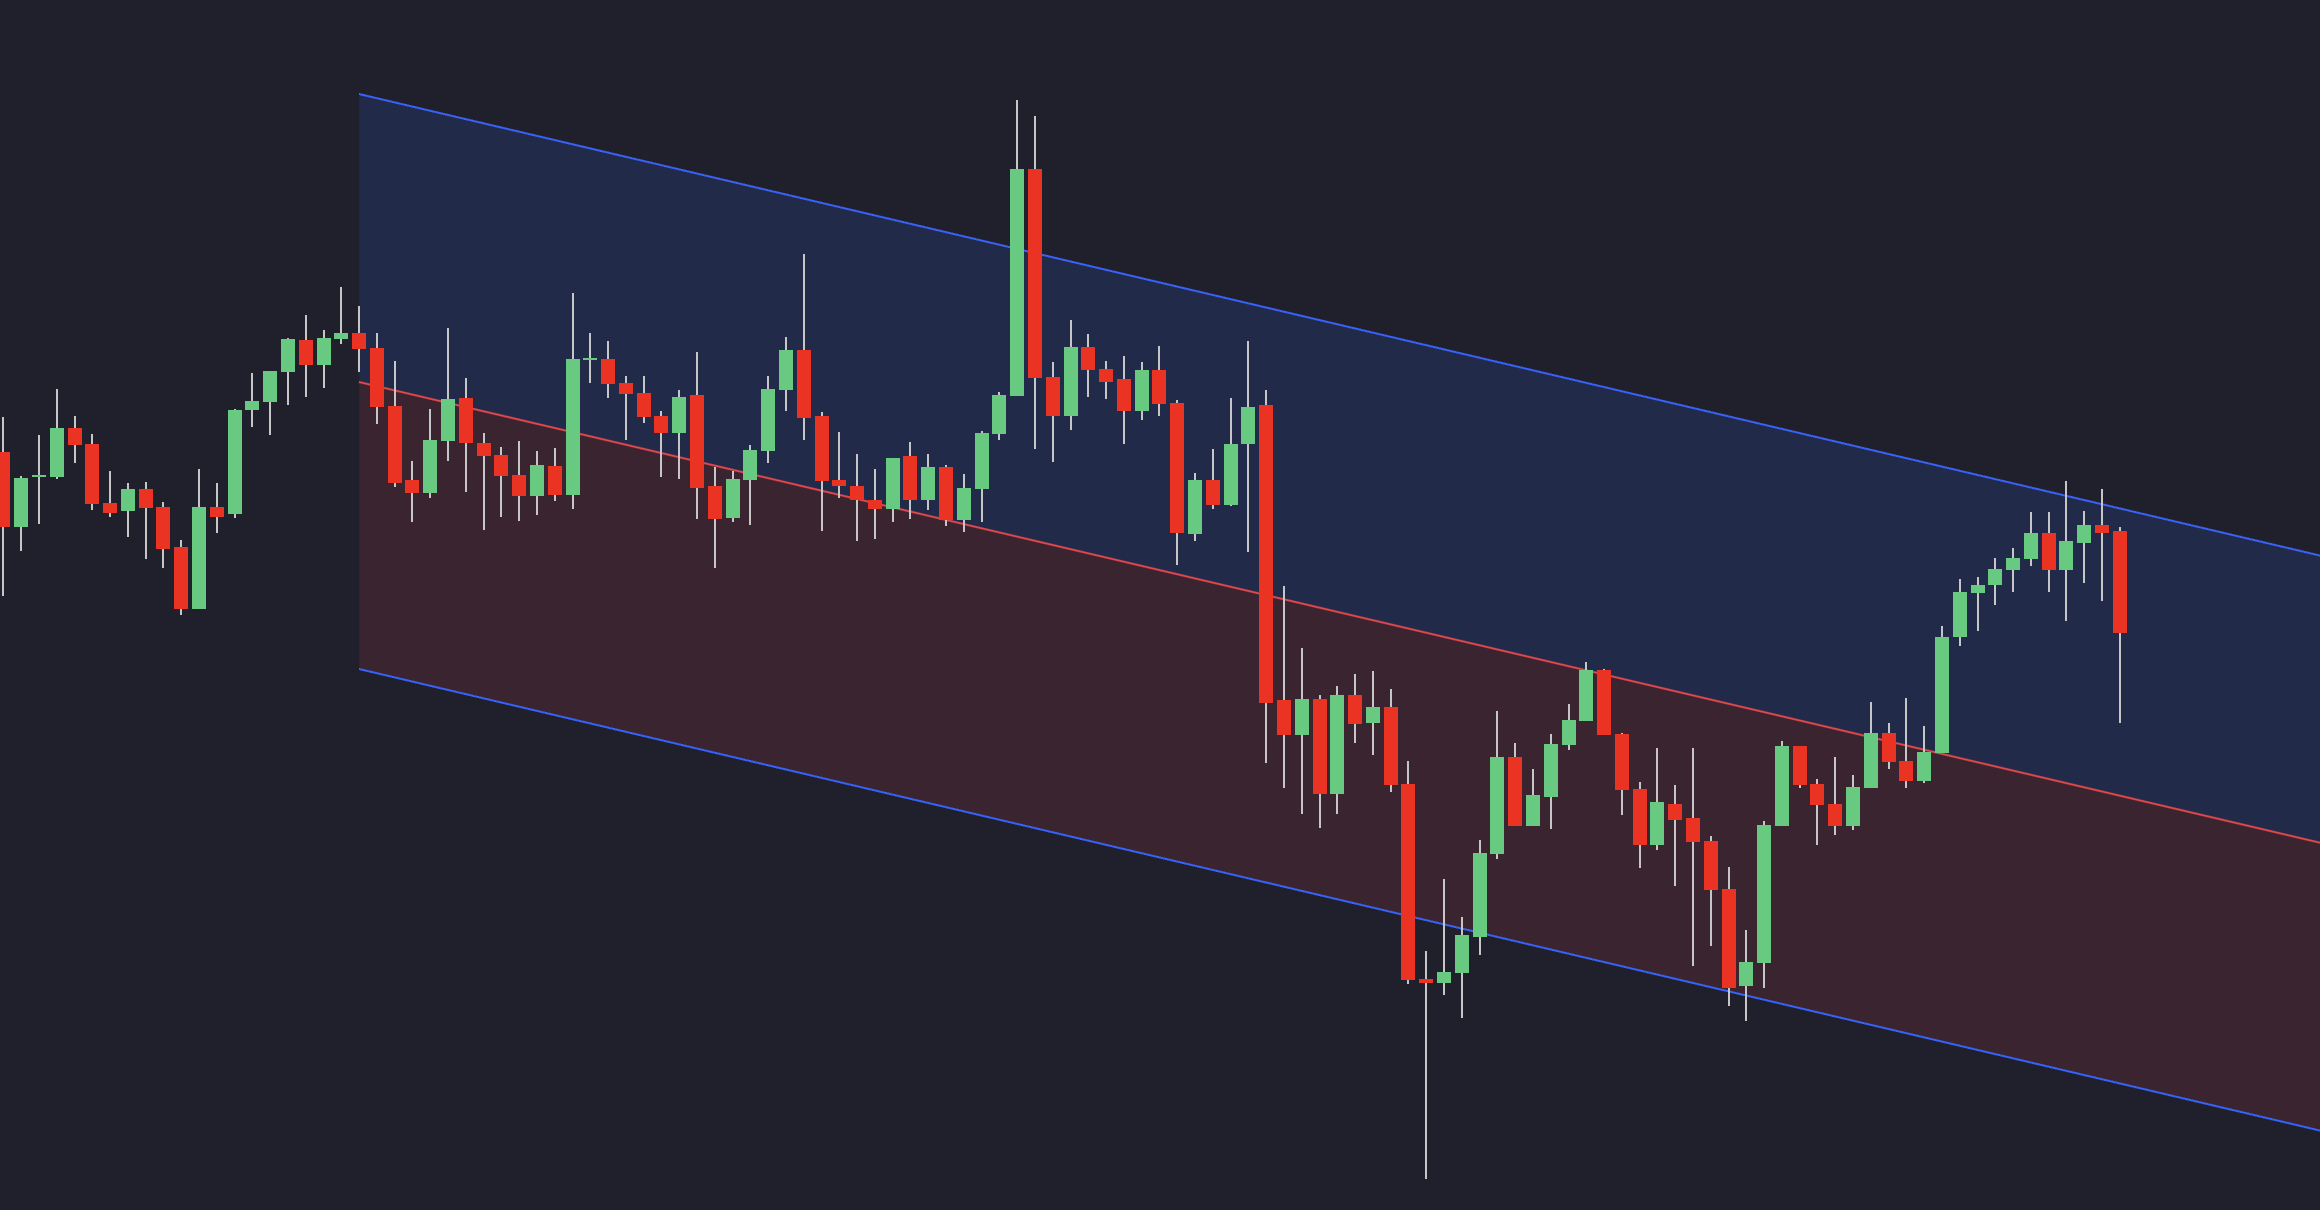
Trading Regression Channels
Linear Regression Channels are used to define dynamic support and resistance levels. They consist of a central line with parallel boundaries, helping traders pinpoint entry and exit points. The width of the channel reflects market volatility, while the slope indicates the strength of the trend.
| Strategy Type | Entry Signal | Confirmation Required |
|---|---|---|
| Breakout Trading | Price closes beyond channel lines | Volume spike and strong candle pattern |
| Channel Trading | Price touches channel boundaries | RSI or MACD convergence |
| Trend Following | Price consistently near channel edges | Slope direction and steepness |
A steeper slope suggests a stronger trend, which can justify more aggressive position sizing. In addition to channel-based entries, traders can also explore mean reversion opportunities when price deviates from the regression line.
Price Reversion Trading
While regression channels highlight trends, mean reversion strategies focus on price returning to its statistical average. The Linear Regression Indicator provides a framework for these trades.
Key steps for execution:
- Entry Timing: Enter trades when the price moves back inside the one standard deviation line after breaching the channel.
- Position Management: Adjust position sizes based on the regression line.
- Confirmation Signals: Use momentum indicators to confirm trades and filter out false signals, especially during strong trends.
Stop-Loss and Profit Targets
For long positions, place stop-losses below the lower channel, move stops to break-even at the regression line, and set profit targets at the upper channel.
For short positions, position stop-losses above the upper channel, adjust stops to the entry price at the regression line, and aim to exit near the lower channel.
A USDJPY example demonstrates how traders can identify effective entry and exit points by combining channel boundaries with support levels, placing stops beyond key support zones.
"Linear Regression Channels are a powerful feature for traders, offering insights into trend direction, potential reversals, and areas of support and resistance." – SPYDER ACADEMY
When scaling positions, consider channel width. Wider channels indicate higher volatility, which calls for smaller position sizes.
Mastering Linear Regression Trading: How to Use It in Mean Reversion
Advanced Linear Regression Tools
Multi-Factor Regression
Multi-factor regression goes beyond single-variable analysis, offering traders a way to evaluate multiple market influences at once. These models generally fall into three categories:
- Macroeconomic Models: Examine large-scale market indicators.
- Fundamental Models: Analyze company-specific data.
- Statistical Models: Combine diverse data points for a more thorough analysis.
By quantifying the relationship between asset returns and key risk drivers, multi-factor models help traders pinpoint the factors that most impact asset prices. This leads to better position sizing and improved risk management.
AI-Enhanced Regression
AI features take regression analysis further by identifying intricate patterns and adapting to changing market conditions. For example, TuringBot’s symbolic regression has demonstrated strong performance in complex scenarios.
- Pattern Recognition: Detects subtle structures for improved predictions.
- Automated Optimization: Continuously updates regression parameters to match shifting market dynamics.
Summary
Linear Regression Trading Benefits
Linear regression offers a clear method to identify price trends and measure their strength and direction. This makes it a valuable approach for both day traders and swing traders seeking accurate entry and exit points.
| Benefit | Application | Impact |
|---|---|---|
| Risk Management | Uses standard deviation channels for stop-loss placement | 68% of price action occurs within one standard deviation |
| Trend Strength Analysis | Measures slope steepness for trend confirmation | Helps quantify bullish or bearish momentum |
Implementation Guide
-
Data Collection and Setup
Collect high-quality historical price data for your chosen assets. Use indicators from the Library to identify clear patterns and set up baseline regression channels. -
Model Development
Build your regression model with these considerations:- Use shorter timeframes (15–60 minutes) for day trading.
- Opt for longer periods (daily/weekly) for swing trading.
- Combine regression analysis with volume data for added confirmation.
- Pair it with momentum indicators like RSI or MACD.
-
Strategy Optimization
Validate and fine-tune your strategy using backtesting features. The Oscillator Matrix can help confirm setups by detecting divergences and additional signals.


