
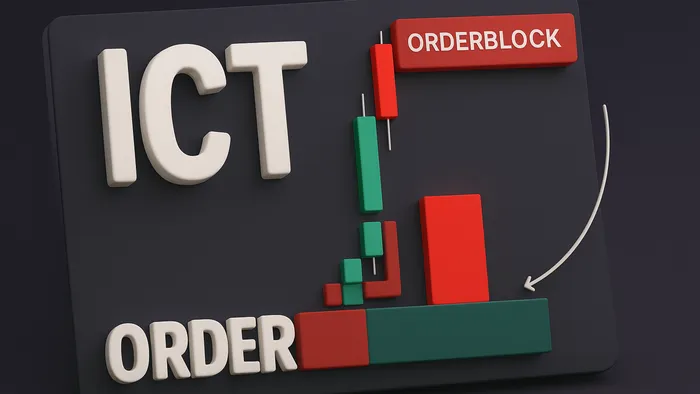

Unpack the concept of Order Blocks and learn how to identify institutional trading patterns that signal market direction.
Order Blocks are price patterns that reveal where institutions place large trades, signaling potential market direction. They are essential for traders because they highlight institutional activity, often found near key levels like monthly highs/lows or weekly support/resistance.
Key Takeaways:
- Bullish Order Blocks: Bearish candles followed by upward moves, acting as support.
- Bearish Order Blocks: Bullish candles followed by downward moves, acting as resistance.
- Market Structure: Align Order Blocks with shifts in price, liquidity sweeps, and Fair Value Gaps.
Trading Methods:
- Aggressive Entries: Enter above/below key candles.
- Conservative Entries: Wait for price confirmation and displacement.
- High-Probability Entries: Focus on liquidity sweeps and market shifts.
The Price Action Concepts toolkit from LuxAlgo on TradingView simplifies analysis by automatically detecting Order Blocks, identifying patterns, and visualizing market shifts. Whether you're spotting reversals or refining strategies, Order Blocks provide clarity on market movements.
Order Blocks Simplified - ICT Concepts
Order Block Formation
Spotting Order Block formations involves identifying price patterns that hint at institutional activity in the market.
Bullish vs. Bearish Order Blocks
Bullish and bearish Order Blocks develop differently, each offering insights into potential price movements:
Bullish Order Blocks:
- Form when bearish candles are followed by upward price movements.
- Serve as support zones for rising prices.
- Often appear at key support levels where institutional buyers step in.
- Frequently coincide with liquidity sweeps below recent lows.
Bearish Order Blocks:
- Emerge when bullish candles are followed by downward price action.
- Act as resistance zones for falling prices.
- Typically form at major resistance levels with active institutional sellers.
- Are strengthened by liquidity sweeps above previous highs.
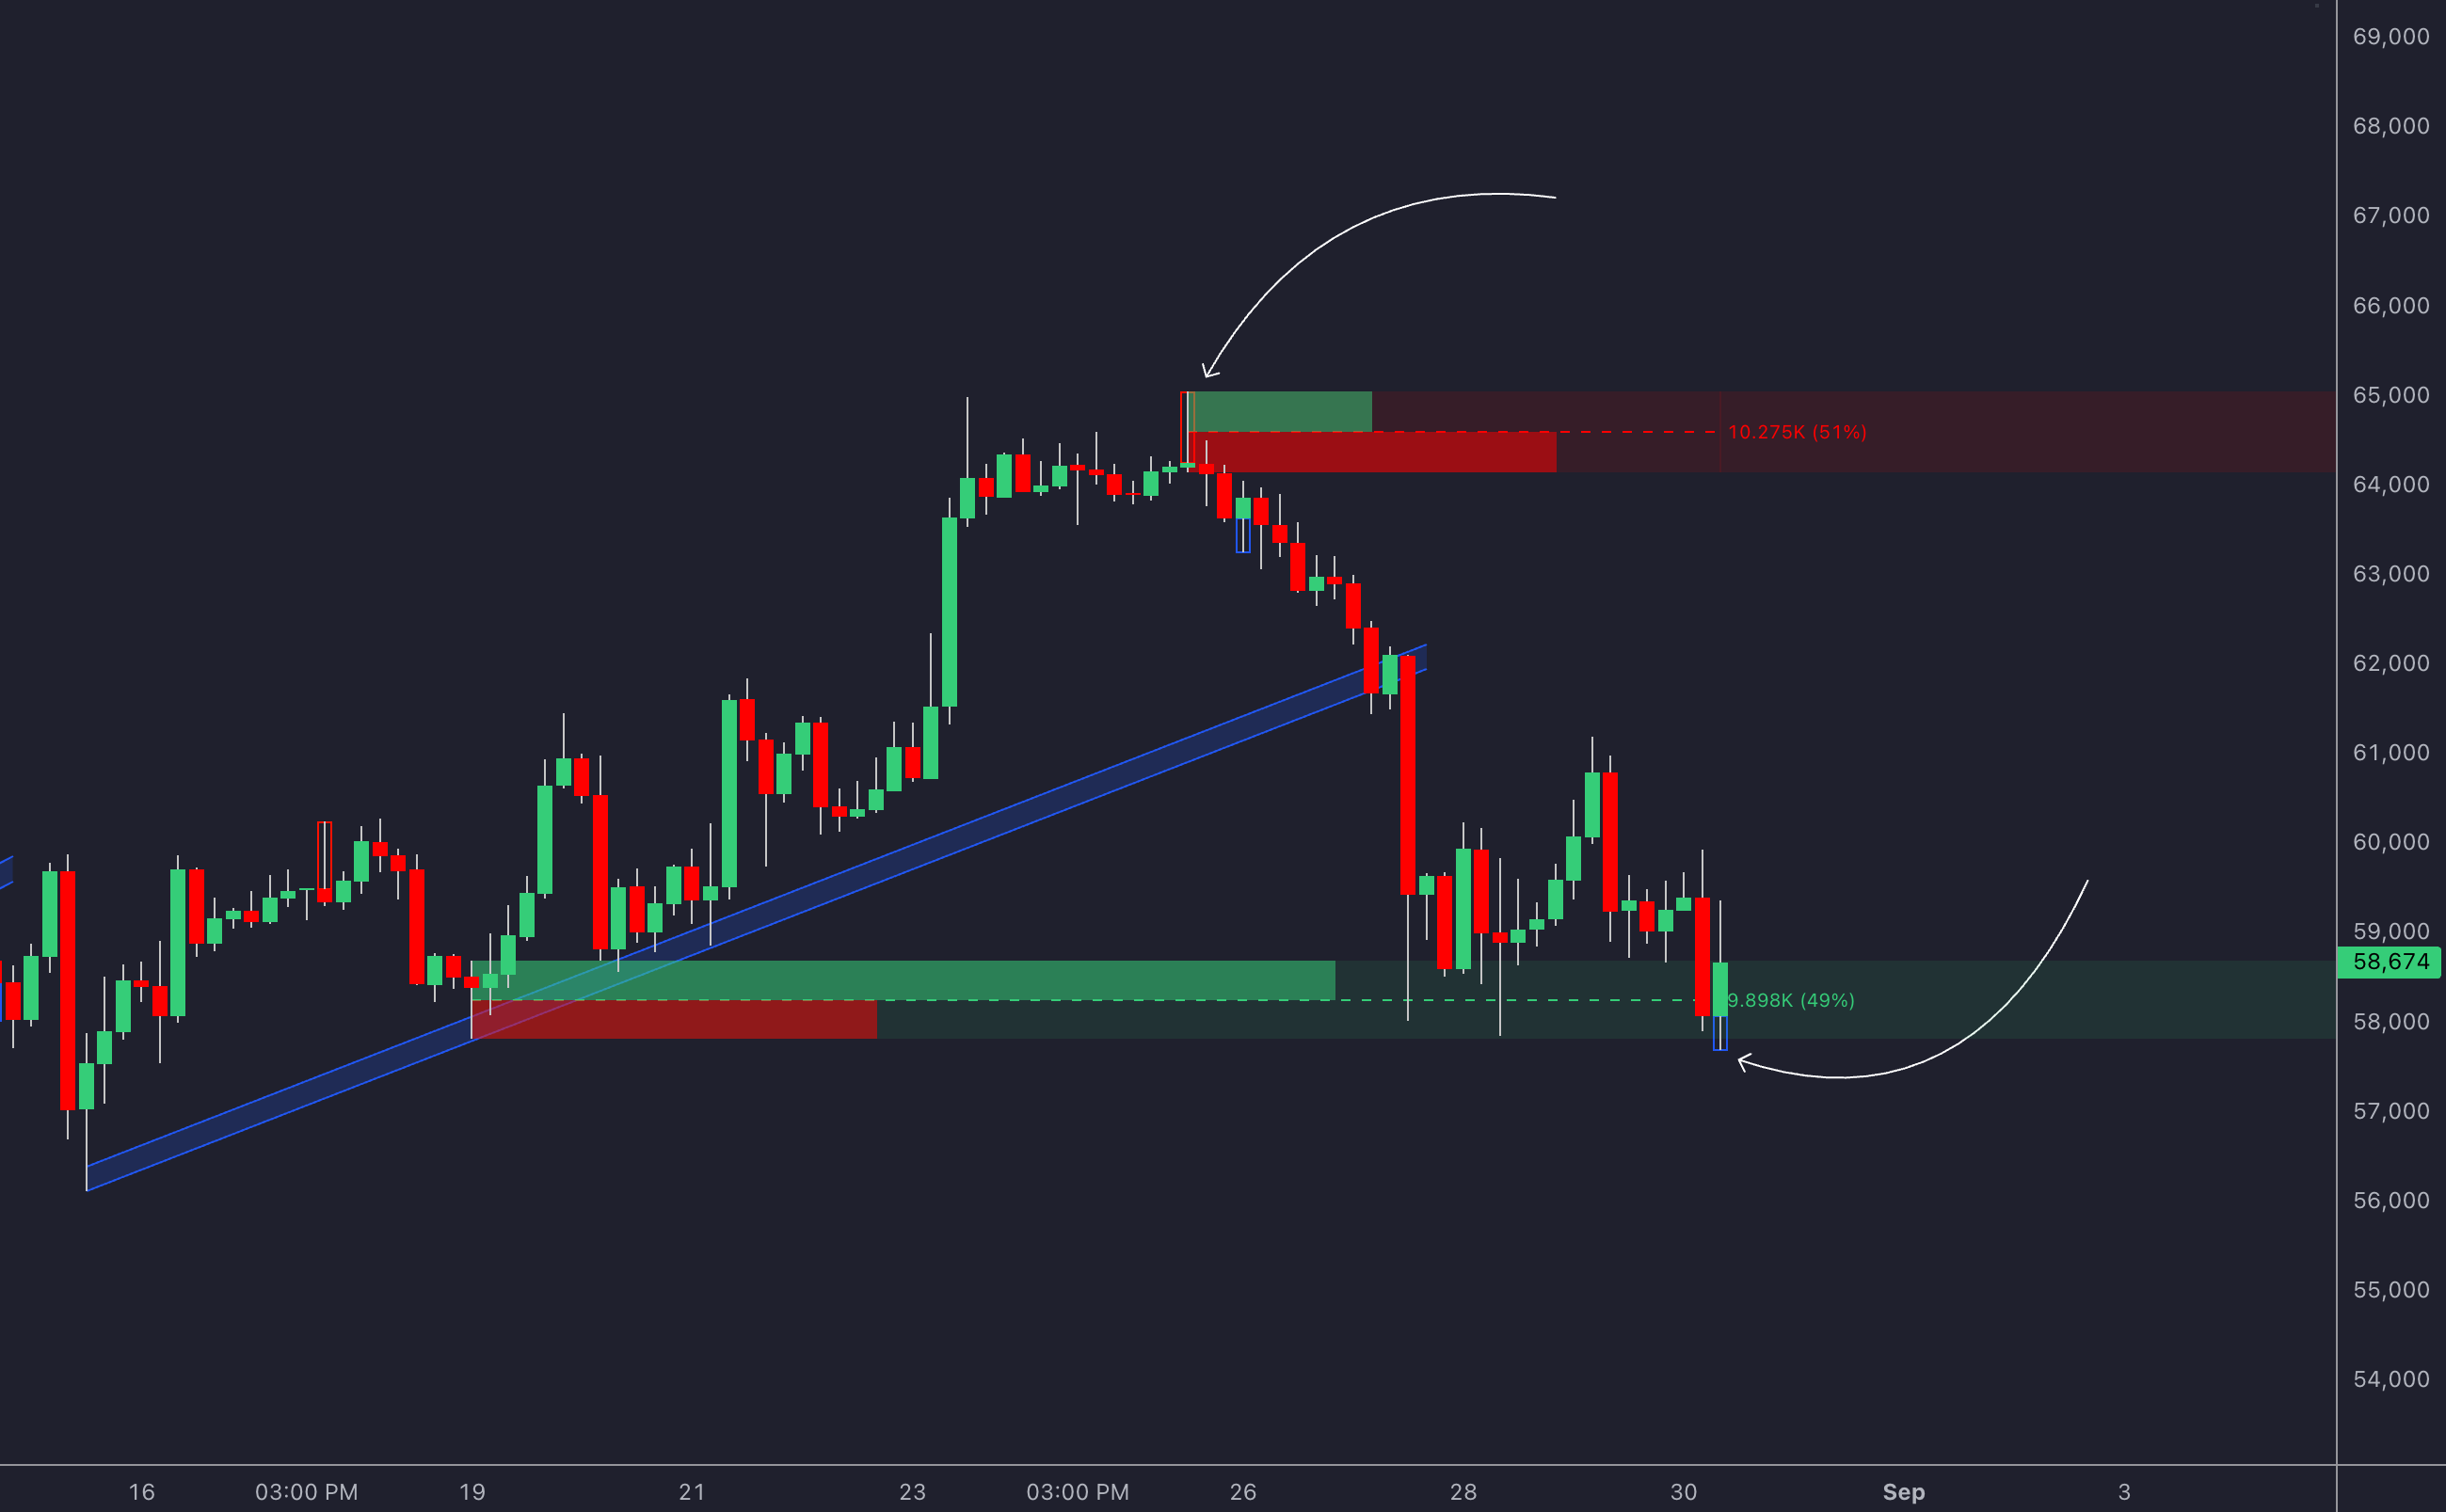
These patterns become more meaningful when analyzed alongside the broader market structure.
Market Structure Analysis
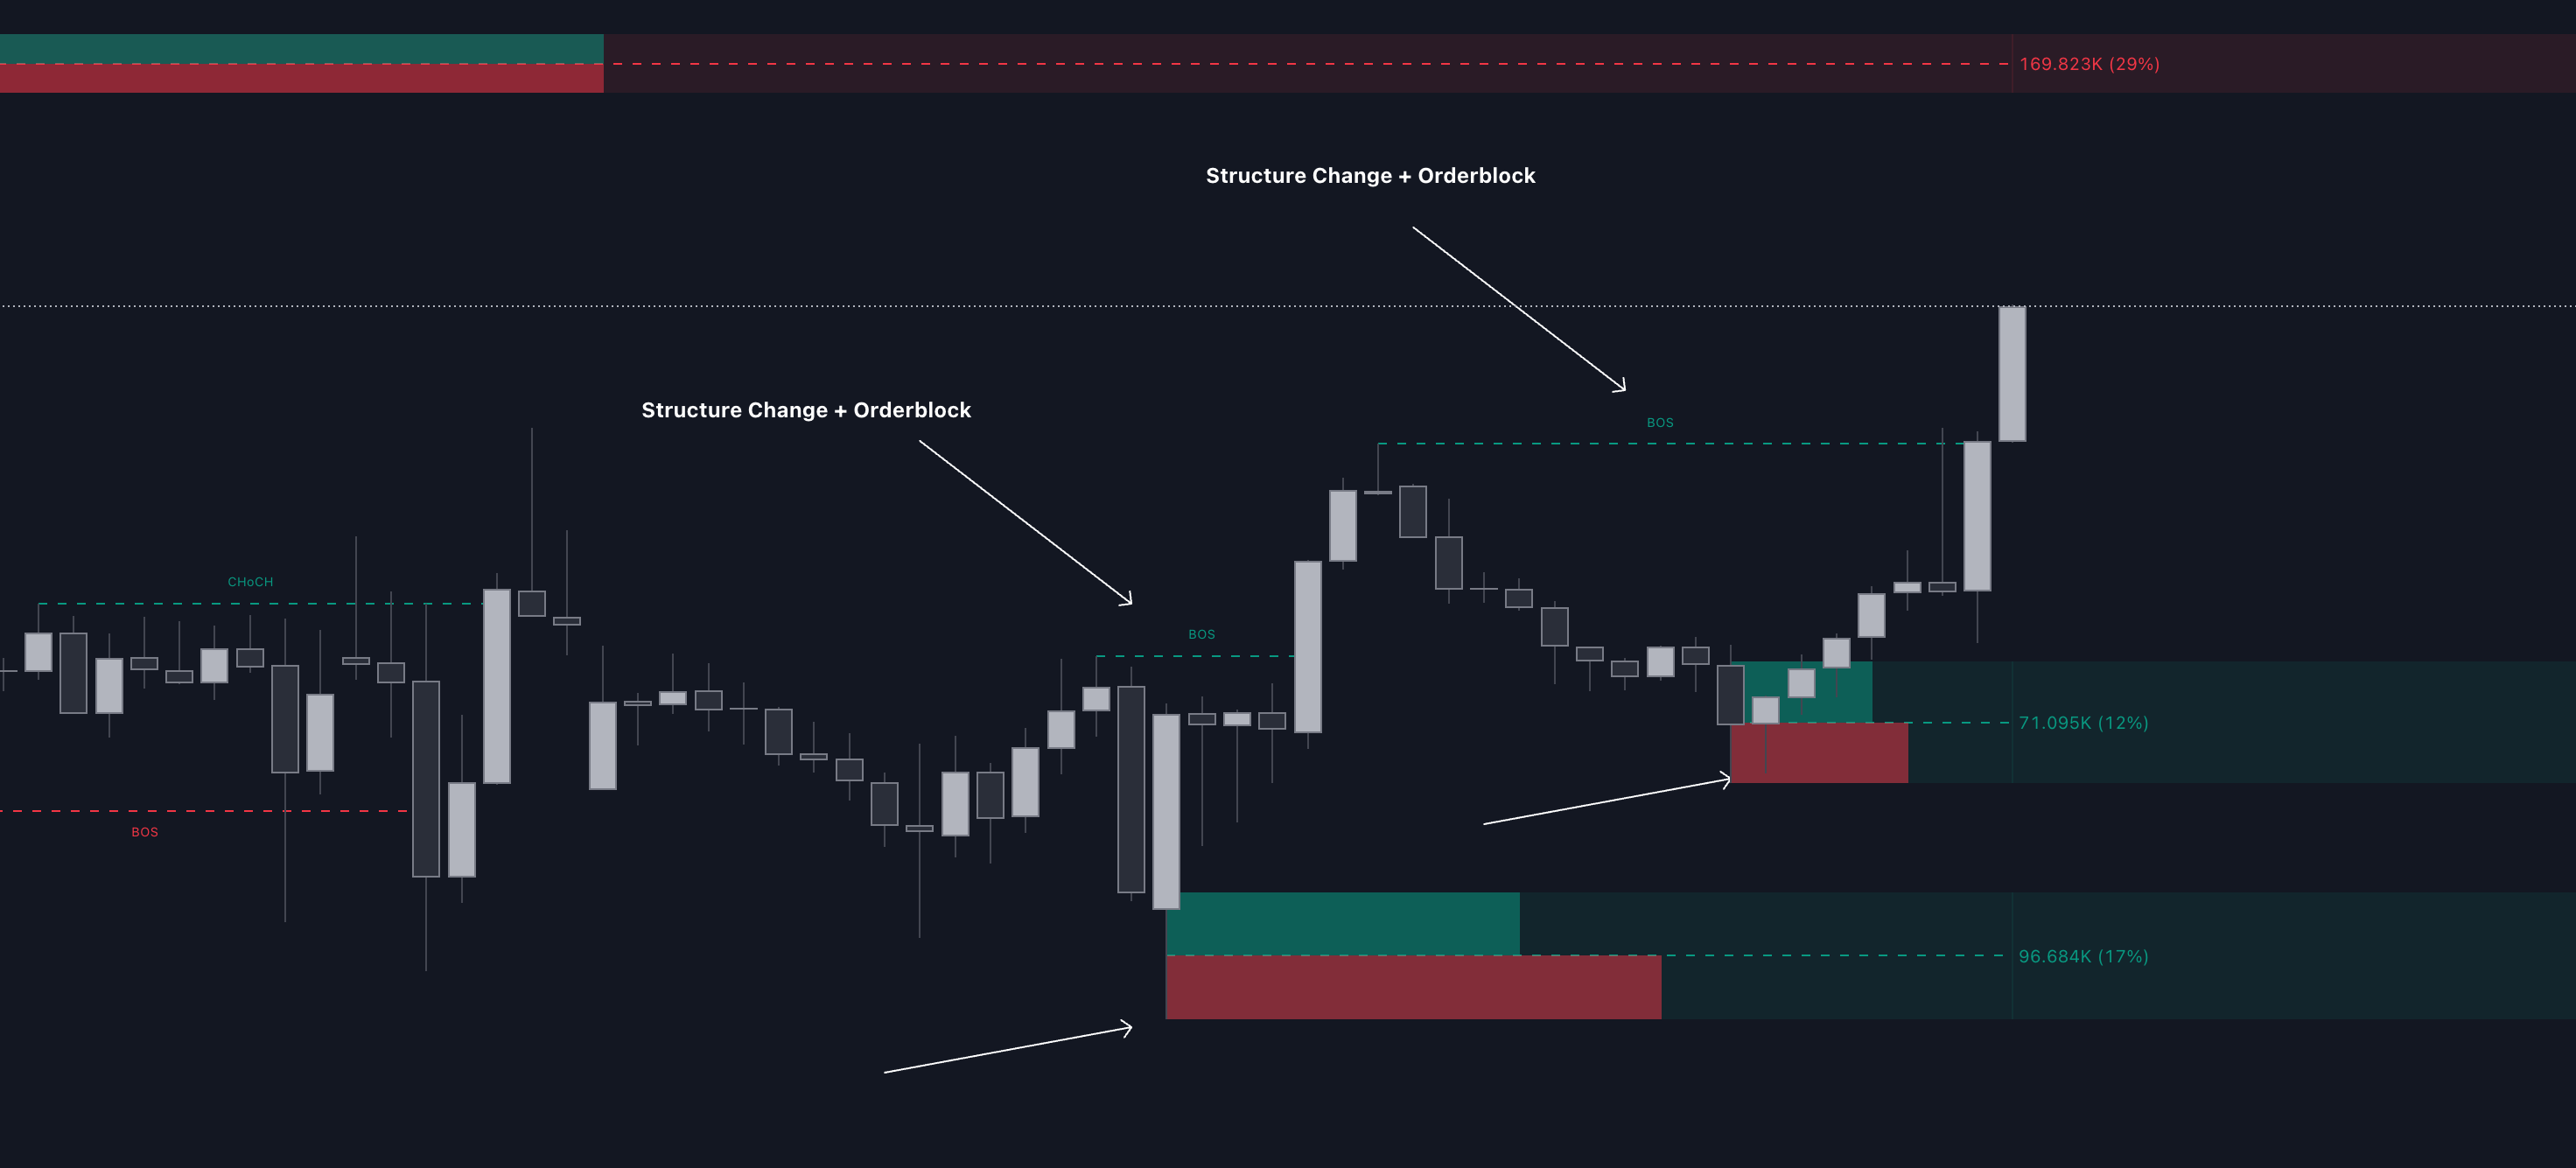
Understanding market structure helps confirm Order Blocks and evaluate their likelihood of success. High-probability Order Blocks often align with core structural elements:
1. Timeframe Alignment
Analyze price action across multiple timeframes to identify key levels:
- Monthly highs and lows.
- Weekly support and resistance zones.
- Daily pivot points.
- Session-specific levels.
2. Change in State of Delivery
Market structure shifts happen when:
- Price moves through the open of a supporting candle.
- Previous highs or lows break in the opposite direction.
- Displacement creates Fair Value Gaps (FVGs).
3. Institutional Level Recognition
Order Blocks frequently appear in areas of institutional interest, such as:
- Major support and resistance zones.
- High-volume price levels.
- Regions where price was previously rejected.
- ICT PD Array levels.
"Breaker Blocks often align with the overall trend, signaling potential reversals or significant price shifts." - Michael J Huddleston
Traders should watch for clusters of stop-loss orders near recent pivot point lows. These areas often attract institutional activity, creating liquidity pools worth monitoring. These structural insights help traders better understand the dynamics of Order Blocks.
Order Block Components
Order Block components provide deeper insights into how institutional activity shapes price movements and market signals.
Institutional Trading Signals
Here are two major signals to watch for:
- Strong Displacement: Large candles paired with Fair Value Gaps often indicate heavy institutional involvement. These gaps occur because the sheer volume of trades causes noticeable price shifts.
- Liquidity Pools: Institutional traders often aim for stop-loss clusters near pivot lows. These clusters create liquidity pools, allowing them to execute large trades effectively.
Price Movement Patterns
Order Blocks often exhibit specific patterns that help traders predict market direction and spot institutional activity. Key elements include:
- Candle Formation: Certain candle patterns can signal institutional positioning before major market moves.
- Market Structure Shifts: These shifts occur when:
- Price crosses the opening of a supporting candle.
- Previous highs or lows are broken.
- Fair Value Gaps form in the price action.
Focusing on areas where institutional buyers or sellers balance immediate execution with positioning is crucial. These zones often appear near key price levels, where large traders can efficiently enter or exit positions while maintaining favorable pricing.
Order Block Trading Methods
Entry Point Selection
Successful Order Block trading relies on precise entry strategies. Here are three approaches based on risk tolerance:
Aggressive Entry Method
This involves placing buy stops above the high of bearish candles within a bullish Order Block. For instance, during the March 2023 EUR/USD session, traders applying this method achieved a 3R profit after the price dipped below the previous day's low and then reversed.
Conservative Entry Method
This method uses a buy limit order, waiting for the price to confirm by breaking above bearish candle highs. Look for strong displacement marked by large candles and Fair Value Gaps, as these signal institutional agreement on the price direction.
High-Probability Entry Method
This approach focuses on Order Blocks that meet specific criteria:
- Key price levels, such as daily or weekly highs and lows
- Liquidity sweeps, hinting at strong reversals
- Clear shifts in market structure
- The presence of Fair Value Gaps
Stop-Loss and Take-Profit Placement
Managing risk effectively involves setting stop-loss and take-profit levels based on the Order Block's structure.
Stop-Loss Guidelines:
- For bullish setups, place the stop just below the Order Block's low.
- For bearish setups, position the stop just above the Order Block's high.
- Add a 5-10 pip buffer to account for market fluctuations.
Take-Profit Strategies:
- Aim for the next key level, such as an opposing Order Block or a significant market structure point.
- Use prior swing highs or lows as additional targets.
- Employ partial profit-taking to lock in gains while letting the trade run.
These methods ensure a structured approach to risk and reward.
Integration with LuxAlgo Price Action Concepts Toolkit
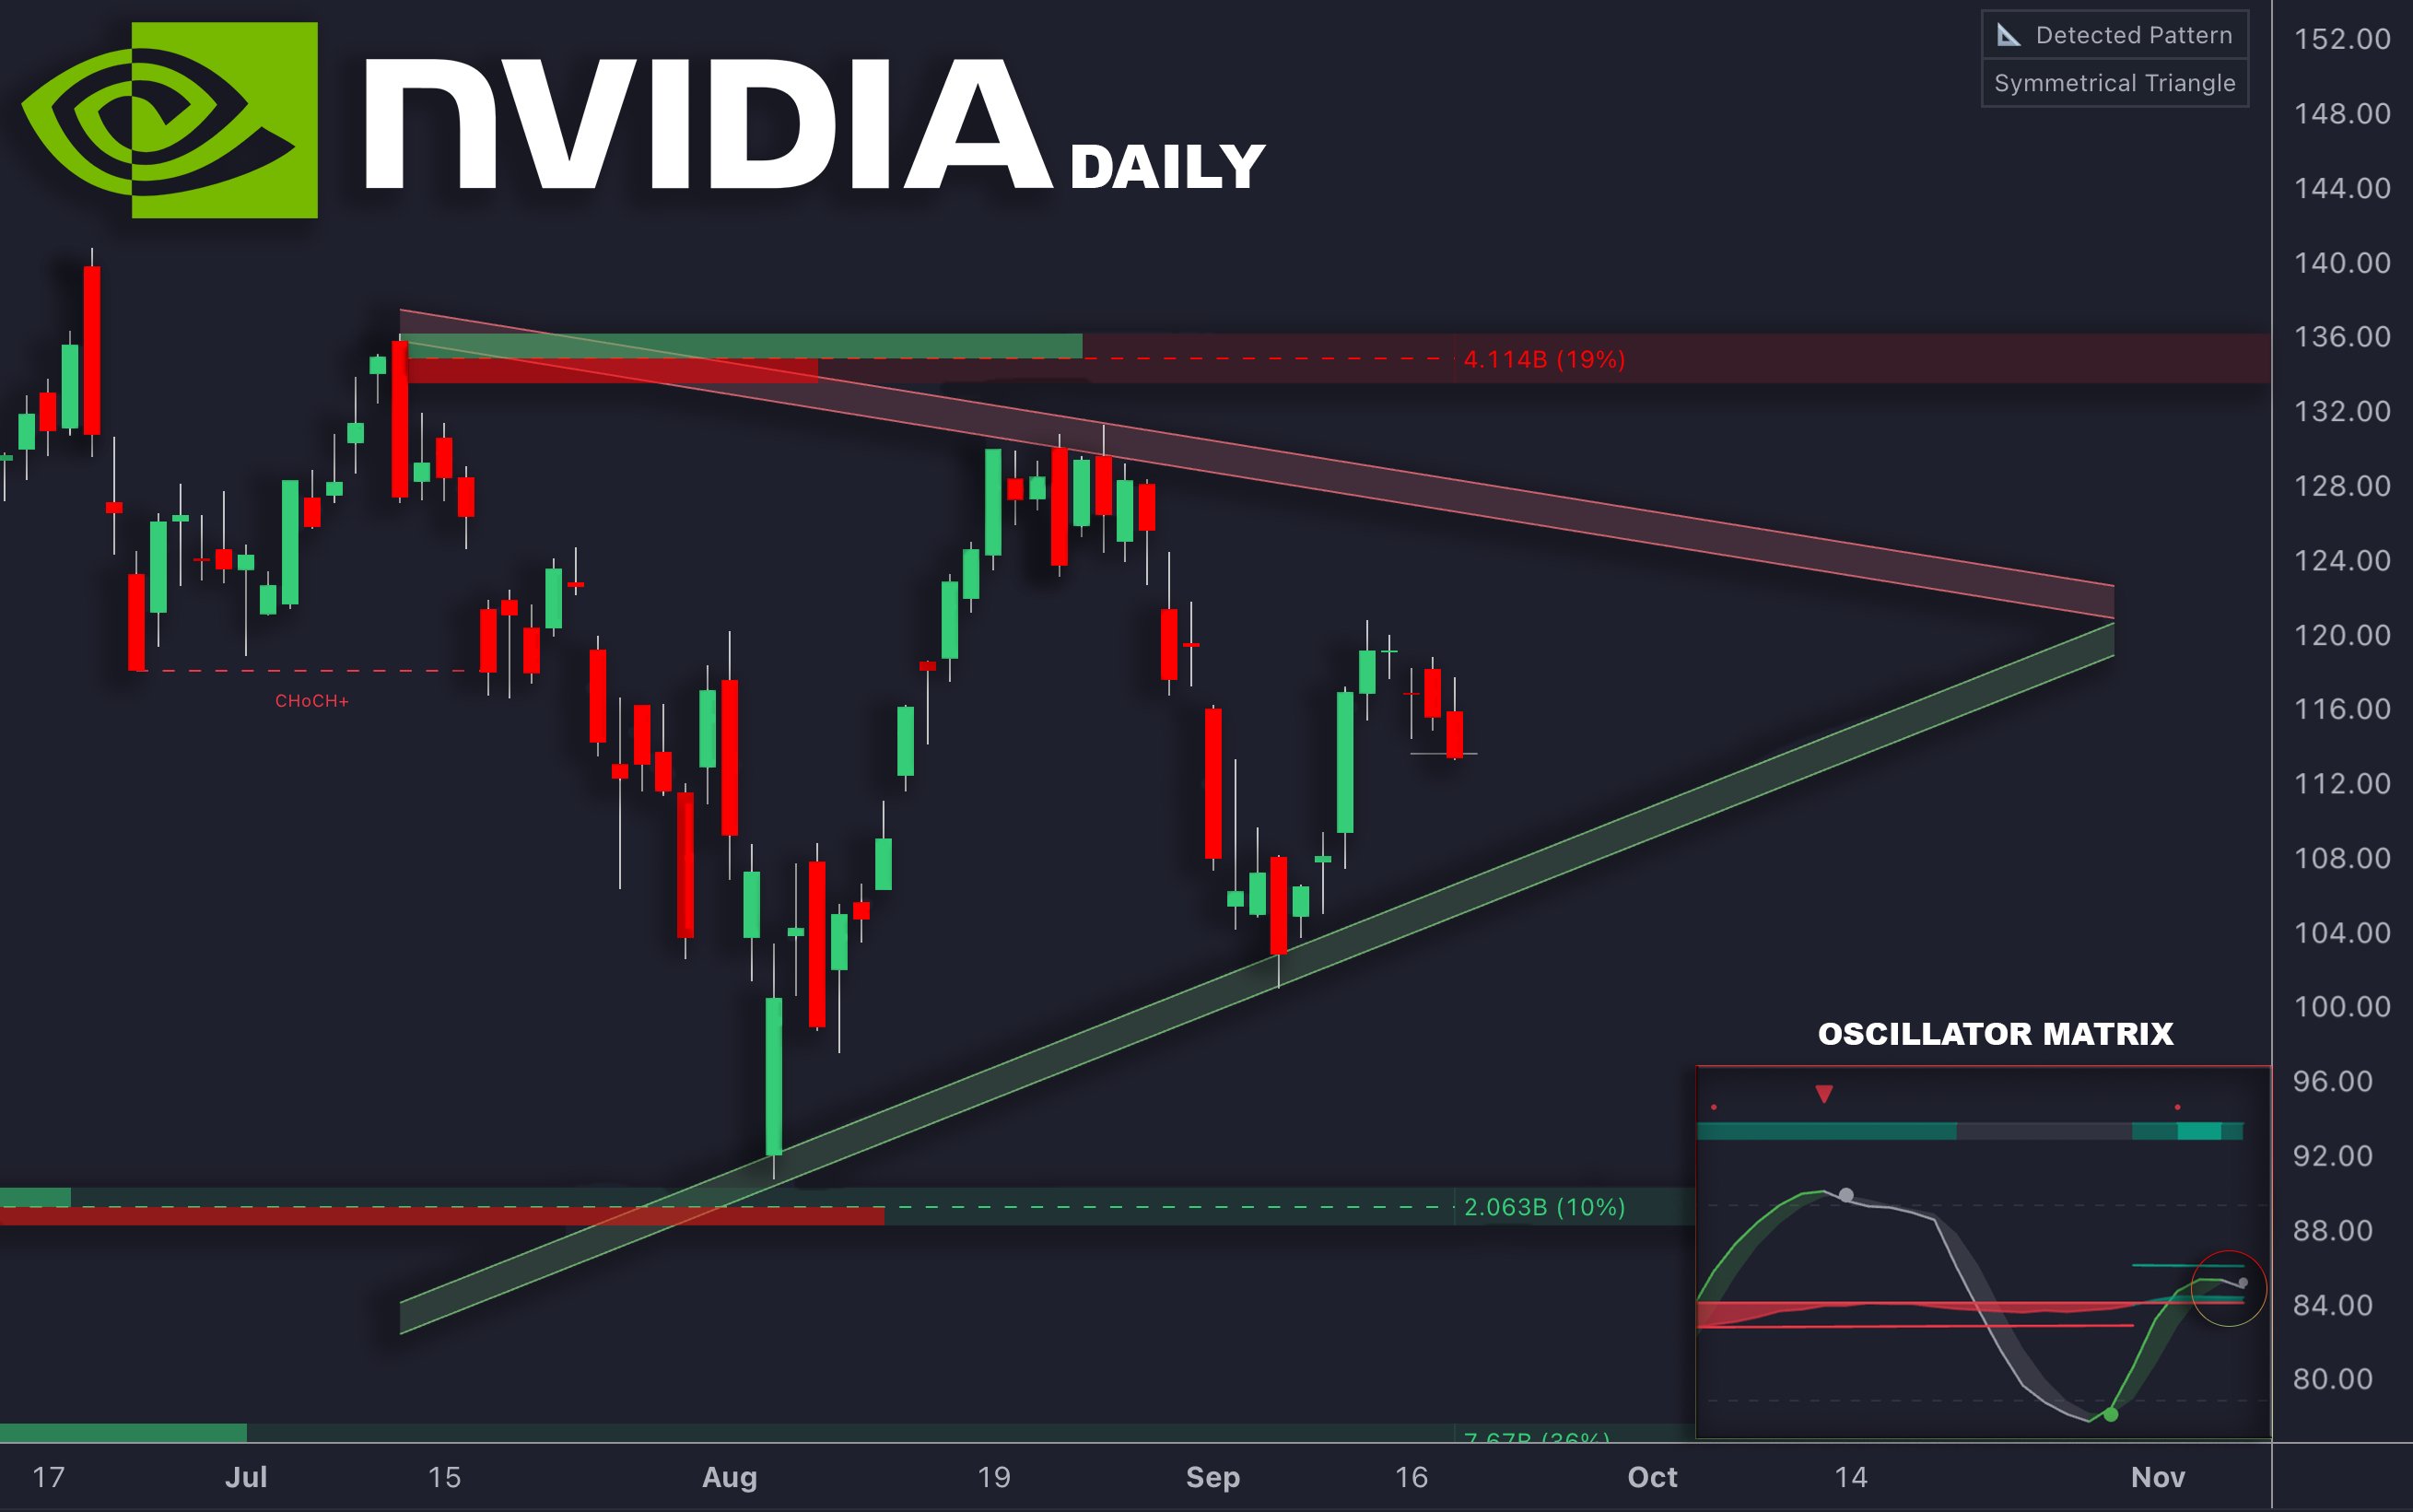
LuxAlgo Price Action Concepts can simplify the process by automating Order Block detection. These tools help optimize swing calculations and visually highlight bullish and bearish blocks with easy-to-read, color-coded markers.
Order Block Analysis Tools
LuxAlgo offers exclusive toolkits that turn manual Order Block analysis into a streamlined, data-driven process. These features, powered by AI and advanced visualization, build on the core Order Block concepts discussed earlier.
LuxAlgo's AI Analysis Features
The ICT Concepts indicator simplifies Order Block analysis with a range of powerful capabilities:
Market Structure Analysis
This feature automatically identifies and displays:
- Real-time detection of Order Block patterns
- Market Structure Shifts (MSS)
- Break of Structure (BOS) points
- Buyside and Sellside liquidity zones
Historical Mode Features
- Past Order Block patterns
- Historical market structure shifts
- Previous trading zones and their outcomes
- Multi-timeframe pattern recognition
The AI Backtesting Assistant supports traders by delivering insights to refine strategies. It allows validation of Order Block setups across various market conditions and timeframes.
LuxAlgo Indicator Features
In addition to AI-driven analysis, the Price Action Concepts toolkit provides practical visualization and customization options:
Advanced Visualization
- Color-coded Order Block identification for clarity
- Separate colors for bullish and bearish blocks
- Visual indicators for market inefficiencies
- Automated detection of Fair Value Gaps
Customization Options
- Adjust swing point detection lookback periods
- Modify how Order Blocks are displayed
- Customize color schemes for better visibility
- Extend block processing beyond killzone boundaries
Integration Features
- Fibonacci retracement tools aligned with market structure
- Automated alert systems for timely updates
- Real-time pattern detection across assets
- Customizable alerts tailored to individual preferences
These tools make Order Block analysis faster and more efficient without sacrificing flexibility. By combining automated detection with customizable settings, traders can concentrate on high-probability setups while cutting down on analysis time.
Conclusion
Order Block analysis offers traders a clearer view of market movements by highlighting institutional signals that can refine trading strategies. By learning to identify Order Blocks, traders can better anticipate reversals, fine-tune entry and exit points, set precise stop-loss levels, and time their trades during key market moments.
LuxAlgo’s Price Action Concepts toolkit simplifies this process with automated detection and AI-driven insights. These tools allow traders to quickly validate setups while staying in control of their decisions. By blending traditional Order Block strategies with advanced visualization and pattern recognition, the toolkit provides a practical and efficient approach to market analysis.
When viewed within the larger market context, Order Blocks help traders understand market dynamics more thoroughly. Features like automated detection of Fair Value Gaps, market structure changes, and institutional activity signals make LuxAlgo’s toolkit a powerful resource for traders seeking deeper insights.
FAQs
What are Order Blocks, and how can traders use them to enhance their trading strategies?
Order Blocks are key price zones on a chart that represent areas where institutional traders have placed significant buy or sell orders. These blocks often appear as the last bullish candle before a downward move or the last bearish candle before an upward move. Identifying them can help traders anticipate potential price reversals or continuations.
To use Order Blocks effectively, focus on key levels such as daily or weekly highs and lows, higher timeframe zones, and areas with clear market structure shifts. Look for signs like liquidity sweeps, strong price movements, or gaps in price action, which may indicate institutional activity. Once identified, traders can wait for price to revisit these zones and plan entries based on their strategy, whether aggressive or conservative.
How do liquidity sweeps and Fair Value Gaps (FVGs) contribute to the creation and validation of Order Blocks?
Liquidity sweeps and Fair Value Gaps (FVGs) are key elements in identifying and confirming Order Blocks. A liquidity sweep occurs when the market takes out stop-loss levels or key liquidity zones, often signaling the involvement of strong buyers or sellers. This can mark the beginning of a potential shift in market direction.
FVGs, on the other hand, highlight price imbalances where the market moves too quickly for orders to fully fill. These gaps often indicate strong momentum and can confirm the formation of an Order Block. Traders may use both liquidity sweeps and FVGs together to pinpoint high-probability trade setups, enhancing their decision-making process and strategy execution.
How does the LuxAlgo Price Action Concepts toolkit help traders identify and analyze Order Blocks more effectively?
The LuxAlgo Price Action Concepts toolkit simplifies the process of identifying and analyzing Order Blocks by offering customizable and user-friendly features. Traders can enable or disable Order Blocks, adjust settings like swing lookback periods, limit the number of visible blocks, and personalize color schemes to suit their preferences.
Additionally, the toolkit provides advanced functionality, such as displaying historical polarity changes and defining Order Block areas using candle bodies. These tools make it easier for traders to spot high-probability setups and integrate Order Blocks seamlessly into their strategies, enhancing both efficiency and accuracy in technical analysis.