
Explore how seasonal patterns in market data can enhance your trading strategy, helping you make informed decisions and manage risks effectively.
Seasonality in markets refers to recurring patterns that happen at specific times of the year, driven by factors like consumer behavior, economic cycles, and natural events. These trends, such as retail stock increases during the holidays or energy demand spikes in winter, can help traders make better decisions by identifying when markets are likely to rise or fall.
Seasonality indicators analyze historical data to highlight these patterns, often using tools like charts, heatmaps, and statistical measures. When combined with other analysis methods, such as technical signals or volume data, they can improve timing and risk management in trading strategies. However, seasonal trading comes with risks, including pattern breakdowns and external shocks, so thorough testing and careful strategy development are essential.
Key takeaways:
- Seasonal trends: Predictable patterns tied to specific times of the year.
- Tools: Charts, heatmaps, and metrics like win rates and average returns.
- Applications: Timing trades, managing risk, and diversifying portfolios.
- Challenges: Risks from market changes, overfitting, and transaction costs.
Charting and Trading Seasonality: Tutorial
Common Seasonal Patterns in Markets
Markets often follow recurring seasonal patterns influenced by natural events, consumer habits, investor sentiment, and production cycles. These recurring trends are not just interesting observations—they can inform trading strategies when paired with a solid understanding of seasonality indicators.
Major Seasonal Market Trends
Traders have long observed several recurring market phenomena tied to the calendar. For instance, stocks often show positive momentum during the end-of-year period, a trend sometimes called the “Santa Claus rally” (what the Santa Claus rally means). Similarly, early January tends to bring fresh activity in specific market segments (the January effect), as investors reposition portfolios for the new year. The phrase “Sell in May and go away” reflects a common belief in a summer market slowdown (historical perspective), while late autumn is often seen as a time to consider re-entering the market. Of course, it’s essential to remember that these are historical trends—past performance doesn’t guarantee future outcomes. Still, understanding these patterns can add valuable context to trading decisions.
Seasonality by Asset Class
Seasonal trends differ across asset classes. Commodities, for example, are heavily influenced by natural cycles, such as planting and harvest seasons, which can drive price fluctuations. Energy markets see shifts based on seasonal consumption patterns, like higher demand for heating in winter or gasoline during summer travel months. Equity sectors often reflect consumer spending habits and fiscal cycles, while currency and bond markets are shaped by broader economic rhythms and institutional practices. Recognizing these cycles can help traders align strategies with the unique behaviors of each asset class.
Tools for Analyzing Seasonal Patterns
Understanding seasonal patterns is just the beginning—having the right tools to analyze and visualize them is what turns knowledge into actionable insights. Modern platforms transform raw data into meaningful seasonal trends, giving traders the edge they need to capitalize on historical patterns.
Building and Reading Seasonality Indicators
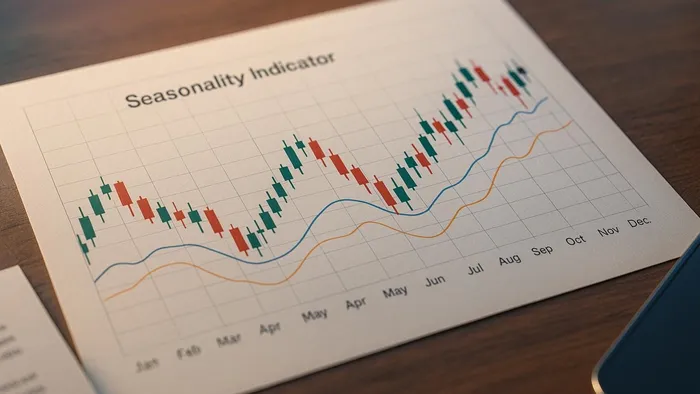
Seasonal charts are the foundation of pattern analysis. These charts map out how an asset has performed during specific months or periods over several years, showing average returns for each month. They act as a visual guide, helping traders identify consistent patterns of strength or weakness.
Heatmaps take it a step further by adding color-coded performance data across timeframes. For instance, a seasonality heatmap might display years on one axis and months on the other, with colors ranging from red (indicating poor performance) to green (indicating strong performance). This makes it easier to spot recurring trends at a glance.
Statistical measures provide the numbers behind the visuals. Metrics like win rates show how often an asset moves in a particular direction during certain periods, while average returns measure the size of those moves. Standard deviation helps assess the reliability of these patterns—a lower deviation implies more consistent behavior over time (why standard deviation matters).
Combining these tools can make your analysis more robust. Start with seasonal charts to identify broad trends, use heatmaps to verify consistency across different years, and rely on statistical measures to validate the patterns. Pay close attention to periods where all indicators align, as these often signal the strongest seasonal opportunities.
LuxAlgo Seasonality Analysis Tools
LuxAlgo provides advanced, integrated tools designed for real-time seasonal analysis.
The LuxAlgo Library offers hundreds of free indicators, including specialized tools for analyzing historical trends. The PAC Toolkit automates price action and can verify seasonal context with volumetric order blocks. The S&O Toolkit compares current price movement with historical behavior using dynamic signal modes and overlays, while the OSC Toolkit flags real-time divergences that could indicate potential seasonal breakouts. You can also use the PAC Screener and OSC Screener to filter assets by seasonal strength and then run tests using the Backtesters for TradingView.
One standout platform is the AI Backtesting Assistant—LuxAlgo’s AI agent for creating trading strategies. The web app evaluates seasonal strategies across multiple tickers and timeframes, optimizing entries and exits based on historical performance while returning performance metrics that help validate your approach. For more background, see the AI Backtesting docs.
What makes LuxAlgo particularly user-friendly is its seamless integration. Seasonal patterns identified with screeners can be quickly tested using the PAC Backtester or S&O Backtester, and the AI assistant can optimize the process end-to-end. This reduces the need to juggle multiple platforms and streamlines the workflow from pattern discovery to strategy execution.
For additional support, LuxAlgo provides live assistance and an active community to help you make the most of these tools.
Using Seasonality in Your Trading Strategy
Now that you're familiar with the tools for seasonal analysis, it’s time to put them to work. Incorporating seasonality into your trading strategy requires a disciplined approach—one that validates patterns, combines multiple indicators, and thoroughly tests strategies before committing capital.
Spotting Seasonal Trends Before Trading
Start by analyzing historical data to identify consistent seasonal patterns. Look for trends that hold statistical significance and align with higher trading volumes, ensuring they stand out beyond the noise of regular market fluctuations.
LuxAlgo’s PAC Toolkit can help confirm recurring patterns using price action context and liquidity features. This helps differentiate genuine market activity from random price changes.
Volume confirmation is another crucial step. Price movements accompanied by above-average trading volume tend to be more reliable. LuxAlgo’s volume analysis indicators—such as Volume Delta Methods—can help you identify when seasonal trends align with heightened participation.
Before acting on a seasonal pattern, test its consistency across a variety of market conditions. Reliable patterns should remain evident during both bullish and bearish markets. This indicates that the underlying drivers—such as earnings cycles, commodity harvest periods, or end-of-year portfolio adjustments—are fundamental rather than coincidental.
Combining Seasonality with Other Indicators
After confirming seasonal trends, enhance your strategy by combining them with additional technical indicators. This layered approach can improve timing and reduce false signals.
For instance, momentum indicators like RSI (Relative Strength Index explained) or MACD (MACD overview) can complement seasonal insights. If an asset enters a historically strong seasonal period and shows positive momentum, your odds may improve. LuxAlgo’s OSC Toolkit is particularly useful for finding confluence between seasonal tendencies and momentum signals.
Support and resistance levels are another valuable tool for refining entries and exits. Instead of jumping into a trade as soon as a seasonal period begins, wait for the price to interact with key levels. LuxAlgo’s S&O Toolkit makes it easier to spot these areas of confluence between seasonal trends and critical price zones.
Trend analysis adds yet another layer of precision. A seasonal signal that aligns with an established uptrend often presents a stronger opportunity than one going against the prevailing market direction. Tools like moving averages and trendlines can help you assess the broader market context before acting.
Lastly, set stop-loss levels based on key technical points and historical volatility. This helps protect your position from unexpected price swings.
By combining seasonal patterns with momentum signals, technical levels, and market trends, you can develop a more refined and reliable trading strategy. When these elements align, they create a solid foundation for testing and optimization.
Testing Seasonal Trading Strategies
Once you’ve validated patterns and integrated indicators, it’s time to rigorously test your strategy. Testing not only confirms reliability but also shows how it behaves across different market conditions.
Use the AI Backtesting Assistant to fine-tune entries/exits and evaluate performance across diverse scenarios. For TradingView-based testing, see the PAC Backtester and S&O Backtester.
When backtesting, focus on key metrics like maximum drawdown, risk-adjusted returns, win rate, and win-to-loss ratio. Don’t forget to factor in transaction costs for a more accurate picture of real-world performance.
To further strengthen your approach, conduct out-of-sample tests and consider walk-forward optimization so parameters adapt as new data arrives. Thorough testing and continuous refinement help ensure seasonal strategies are both reliable and adaptable.
Pros and Cons of Seasonal Trading
Now that we've explored seasonal patterns and the tools used to analyze them, let's break down the strengths and challenges of seasonal trading. While it offers compelling opportunities, it also comes with risks.
Benefits of Seasonal Trading
Seasonal trading is rooted in data-driven decision-making, allowing traders to rely on historical patterns instead of guesswork or market rumors. This approach adds an objective layer to your strategy.
A predictive edge is another major advantage. Knowing that certain assets tend to perform well during specific times of the year gives you the ability to plan ahead and position trades strategically.
Timing is everything in trading, and seasonal analysis provides improved timing. It doesn't just help you decide what to trade—it helps you pinpoint when to trade it. Instead of entering at random, you can align decisions with periods that historically show higher probabilities of success.
Seasonal insights also enhance risk management. By identifying periods of heightened volatility, you can adjust exposure accordingly.
Finally, seasonality can aid in portfolio diversification, uncovering unique patterns across asset classes so you can spread risk across time periods and market segments.
Challenges of Seasonal Trading
However, seasonal trading isn't without its challenges. One major risk is pattern breakdown as economic regimes shift or policy shocks emerge.
Another pitfall is overfitting, where traders mistake random historical occurrences for meaningful patterns.
External shocks—like the 2008 financial crisis or the COVID-19 pandemic—can completely override seasonal trends.
Limited sample sizes can mislead if a pattern is based on too few occurrences.
Competition and market efficiency reduce the impact of widely known patterns (e.g., the January effect), and transaction costs can erode performance.
Comparison Table: Pros and Cons
| Advantages | Limitations |
|---|---|
| Relies on historical data for objective decisions | Pattern breakdown due to changing market conditions |
| Provides a predictive edge for timing trades | Overfitting random trends as meaningful patterns |
| Helps with timing trade entries and exits | External shocks can disrupt seasonal trends |
| Enhances risk management by identifying volatile periods | Limited sample sizes may lead to unreliable conclusions |
| Supports portfolio diversification through varied asset classes | Market efficiency reduces the impact of well-known patterns |
| Reduces emotional decision-making with an objective framework | Frequent trading increases transaction costs |
| Works across different asset classes and timeframes | Requires ongoing monitoring and strategy adjustments |
Seasonal trading can be powerful when used wisely. The key is understanding limitations and combining it with complementary analysis and risk controls. Aim to uncover statistical advantages that, over time, can enhance your overall approach.
Conclusion: Using Seasonality with Confidence
Seasonality indicators provide a way to spot recurring market patterns and make decisions grounded in historical trends. This guide covered how these patterns develop, how to evaluate them, and how to incorporate seasonal insights into your process.
The foundation of successful seasonal trading lies in recognizing that patterns suggest probabilities, not guarantees. They’re most effective when paired with other analytical tools and strong risk management.
To stay balanced, combine seasonal insights with a clear plan. Unexpected events, evolving conditions, and competition can disrupt even consistent patterns. Diversifying across timeframes, asset types, and analytical methods helps mitigate risk.
LuxAlgo provides advanced indicators, screeners, and backtesting on TradingView—making seasonal analysis more accessible and testable. A strong analytical foundation is crucial for navigating market complexity.
Test strategies rigorously and let data drive decisions. With the right mindset and tools, seasonality can become a valuable part of your trading arsenal.
FAQs
What are the best ways to manage risks when trading seasonal market patterns?
To handle risks effectively when trading seasonal market patterns, it's essential to stick to a disciplined strategy. Begin by establishing clear stop-loss levels that take seasonal fluctuations into account. These predefined exit points can help you cap potential losses before they escalate. Another critical step is adjusting your position sizes to match your personal risk tolerance and the typical variability tied to seasonal trends.
It’s also wise to balance historical seasonal data with the current market landscape. Relying solely on past patterns can lead to blind spots, so factor in present-day conditions to make informed decisions. By staying flexible and regularly updating your approach, you can better manage the uncertainties of seasonal trading while safeguarding your investments.
How can I test and confirm seasonal trading patterns before using them in my strategy?
To evaluate seasonal trading patterns, start by using backtesting with a robust set of historical market data. This approach lets you check how reliable and effective these patterns have been over time—ideally across multiple regimes. Aim to analyze data covering at least 15–25 years to capture long-term trends and account for unusual behavior. Where applicable, consider execution benchmarks like VWAP during simulations to reflect realistic fills.
It’s also helpful to compare seasonal patterns with other factors like technical indicators, business cycles, or earnings reports. Testing patterns under varied timeframes and market conditions provides further assurance of their consistency. By following these steps, you can integrate seasonal trends into your trading strategy with greater confidence.
How can using seasonal analysis tools from LuxAlgo improve my trading strategy?
LuxAlgo’s seasonal analysis tools highlight recurring market patterns and trends from historical data. They make it easier to spot seasonal behaviors, helping you decide the best times to enter or exit trades.
By combining historical trend analysis with automated signals, these tools reduce guesswork. They help you time trades with greater precision, manage risks, and capitalize on predictable market movements. This approach not only sharpens your trading performance but also builds confidence in your decisions.
References
LuxAlgo Resources
- LuxAlgo Library
- Market Performance by Yearly Seasons
- Seasonality Widget
- Seasonality Chart
- PAC Toolkit (Docs)
- S&O Toolkit (Docs)
- OSC Toolkit (Docs)
- PAC Screener
- OSC Screener
- Volumetric Order Blocks
- Real-Time Divergences (Indicator)
- Backtesters (Features)
- AI Backtesting Assistant
- AI Backtesting Assistant (Docs)
- PAC Backtester (Docs)


