
Learn how the Stick Sandwich candlestick pattern can signal market reversals, its structure, and effective trading strategies.
The Stick Sandwich candlestick pattern is a three-candle formation used in technical analysis to spot potential market reversals. It comes in two types: bullish (red-green-red) and bearish (green-red-green). You can explore hundreds of similar formations for free in the LuxAlgo Library. Here’s what you need to know:
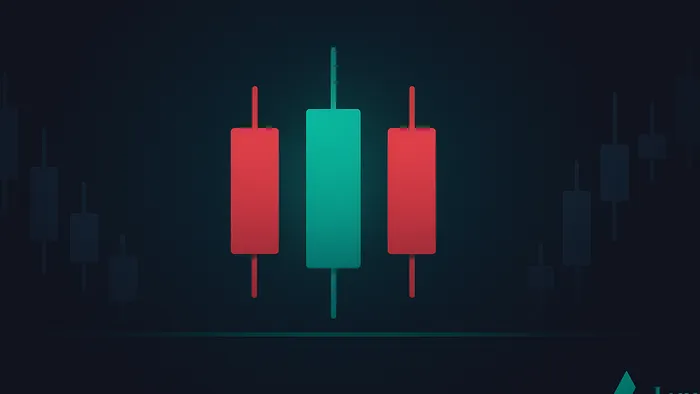
- Structure: Two outer candles with the same closing price and a contrasting middle candle.
- Market Context: Appears in downtrends (bullish) or uptrends (bearish).
- Confirmation: High trading volume on outer candles and follow-up price action within three days.
- Usage: Works as a bearish continuation signal 62 percent of the time, with an average ten-day price change of 7.43 percent in bear markets (internal LuxAlgo backtests).
For better results:
- Combine with indicators like RSI, MACD, and moving averages.
- Use volume analysis to validate the pattern.
- Focus on strict entry, exit, and risk-management rules.
This pattern is effective but short-lived, so timing and additional confirmation are critical for success.
Finding Stick Sandwich Patterns
Pattern Requirements
A Stick Sandwich formation is made up of three candles. The outer candles have larger ranges and higher trading volume compared to the middle candle. In a bullish setup, the first and third candles are bearish with wide ranges, while the middle candle is bullish and has a smaller range. For a bearish setup, the outer candles are bullish with wide ranges, and the middle candle is bearish and has a shorter range.
Pattern Types and False Signals
For a Stick Sandwich pattern to be valid, the middle candle must be fully engulfed by the outer candles. High trading volume on the outer candles adds credibility, and confirmation usually happens within three days. Be careful not to confuse this with the Matching Low pattern, which involves two candles with the same closing price but lacks the contrasting middle candle. LuxAlgo’s Pattern Detector automatically flags Stick Sandwich setups and differentiates them from look-alikes.
Chart Tools and Setup
TrendSpider’s scanner is useful for spotting Stick Sandwich patterns across multiple markets. TradingView users can set price alerts directly inside the Signals & Overlays toolkit. Advanced users may leverage Alert Scripting to chain multiple conditions. Many traders wait for a breakout at the third candle—either below its low in a bearish setup or above its high in a bullish one—before entering. Combining the Stick Sandwich with other LuxAlgo toolkits helps filter false signals and strengthens your framework.
Market Behavior Analysis
Up and Down Trends
The Stick Sandwich pattern often appears when market sentiment shifts without an obvious catalyst. During strong trends, it highlights sentiment changes. In an uptrend, this formation may signal a brief pause rather than a full reversal, encouraging traders to watch pullbacks closely. In a downtrend, it starts with a bearish candle, followed by an unexpected higher open and upward move.
LuxAlgo’s Market Structure Oscillator can help track these shifts and identify whether the current momentum supports the pattern.
Pattern Verification Methods
To confirm a Stick Sandwich pattern’s reliability, traders can use several techniques:
- Volume Analysis: Ensure the outer candles have significantly higher volume than the middle one.
- Moving Average Signals: Look for crossovers where shorter-term averages climb above longer-term ones, especially if the pattern forms near those averages acting as support or resistance.
- Advanced Pattern Check: Indicators like the Master Pattern and Reversal Candlestick Structure can confirm whether price is contracting or reversing at key liquidity areas.
Market liquidity plays a big role in how reliable this formation is. In highly liquid assets like large-cap stocks, it often reflects major participants testing levels before committing. In currency pairs—where macro factors dominate—the pattern may be less dependable.
For the best outcomes, focus on patterns near the end of established downtrends. Reliability improves when outer candles show high volume and the middle candle has noticeably lower volume.
Trading the Stick Sandwich
Trade Entry-and-Exit Rules
Enter a trade only after price breaks above the high of the third candle with conviction. Before committing capital, many traders will back-test the setup using LuxAlgo’s AI Backtesting Assistant or run a quick simulation on the AI Backtesting platform.
Entry conditions:
- Breakout above the third candle’s high.
- Confirmation via a strong candle closing beyond that high.
- High volume on the first outer candle.
For exits, target nearby resistance or aim for 2–3 × your initial risk. Always apply strict risk management once in a trade.
Risk Control Methods
After entry, set your stop-loss below the pattern’s low, using it as a natural support reference.
| Risk Component | Implementation Strategy | Rationale |
|---|---|---|
| Position Size | Risk ≤ 1 percent of total capital | Protects overall equity |
| Stop Loss | Just below pattern’s low | Leverages pattern’s support |
| Take Profit | Next resistance or 2–3 × risk | Maintains healthy reward/risk |
| Volatility Adjustment | Wider stops in choppy markets | Avoids premature stops |
Adding Other Indicators
Boost accuracy by pairing the Stick Sandwich with:
- RSI for oversold/overbought signals.
- Fibonacci retracements around 50–61.8 percent levels.
- Moving Averages as dynamic support/resistance checks.
- Volume Analysis to confirm outer-candle strength.
- Pure Price Action Structures to highlight key swing points.
Mastering the Bearish Stick Sandwich Candlestick Pattern
Pattern Examples
Let’s dive into Stick Sandwich examples from both bull and bear scenarios.
Common Mistakes to Avoid
| Mistake | Result | Fix |
|---|---|---|
| Ignoring Context | Lower accuracy | Include broader market analysis |
| Entering Too Early | Higher risk | Wait for three-day confirmation |
| Overlooking Volume | Weaker signals | Confirm outer-candle volume |
| Pattern Misidentification | False signals | Differentiate from Matching Low |
Stick Sandwich setups often lose potency within days, making prompt action crucial.
Trading Checklist:
- Ensure full pattern formation.
- Analyze overall market conditions.
- Validate via complementary indicators.
- Account for algorithmic order flow.
In today’s markets, algorithmic activity means traders must go beyond basic formations.
Conclusion
This guide has broken down the Stick Sandwich pattern, showing how three contrasting candles can signal potential reversals. Spot the formation after clear price swings, and confirm via volume and follow-up action.
Remember to combine it with volume analysis, trend checks, and a disciplined risk plan. Use it as part of your broader technical-analysis toolkit and explore additional features across the LuxAlgo platform.
References
- LuxAlgo Candlestick Structure Indicator
- Signals & Overlays Price Alerts Guide
- Oscillator Matrix Reversal Signals Guide
- LuxAlgo Trading Toolkits Overview
- Pattern Detector Indicator
- Market Structure Oscillator Indicator
- Signals & Overlays Toolkit Introduction
- Alert Scripting Feature Overview
- Master Pattern Indicator
- AI Backtesting Assistant Docs
- AI Backtesting Assistant Platform
- LuxAlgo Indicator Library
- LuxAlgo Features Overview
- Reversal Candlestick Structure Indicator
- Pure Price Action Structures Indicator
- Investopedia: Candlestick Patterns
- TrendSpider Scanner


