Opening Range Breakout (ORB) Trading Strategy: How it Works
The Opening Range Breakout (ORB) strategy defines a session’s early high and low, then looks for a qualifying move beyond those boundaries. The range gives you a repeatable reference; it does not establish that the next breakout will succeed. A useful ORB plan specifies the session, range-building window, entry trigger, invalidation, position size and exit before the trade.
For a stock with an opening range of $48–$50, a move above $50 is a possible long setup and a move below $48 is a possible short setup. Whether either becomes a trade depends on your rules and the actual fill. A price touch, a candle close and a successful retest are different entry models.
LuxAlgo’s charting and AI platform supports the research process: inspect session levels on Quant Charts, use a dedicated opening-range indicator from the Library, and ask Quant, our coding agent, to help implement and test the complete strategy. This guide covers the range, execution, filters and risk calculations that those rules need.
How to Find the Opening Range
The opening-range high (ORH) is the highest traded price during the chosen window; the opening-range low (ORL) is the lowest. Range width equals ORH minus ORL, and the midpoint is their average. Once the window ends, freeze those values for the breakout model instead of continuing to expand the range with later prices.
Choose the Session and Range Window Separately
For a U.S. stock strategy anchored to the regular session, the NYSE core session starts at 9:30 a.m. Eastern Time and normally ends at 4:00 p.m. Eastern Time. Use America/New_York or the correct exchange timezone in your implementation. Writing “9:30 EST” all year introduces a daylight-saving error when New York observes EDT.
A 15-minute range built from 9:30 through just before 9:45 becomes final at 9:45. On one-minute bars, that convention includes the bars starting at 9:30 through 9:44. A close-confirmed signal can be evaluated only after the qualifying post-window candle closes; it cannot use the eventual range high while that range is still forming.
The opening-range duration is not the same as the chart interval. You can build a 30-minute range and evaluate entries on one-minute or five-minute candles. Those execution intervals produce different signals and fills. A candle that straddles the end of the range needs explicit handling, such as using finer data, rather than silently including prices from after the cutoff.
| Range window | At a 9:30 a.m. ET start | Potential use | Tradeoff to test |
|---|---|---|---|
| 5 minutes | Final at 9:35 | Earlier intraday setup | Less opening information; spreads and initial swings can dominate |
| 15 minutes | Final at 9:45 | A defined early-session reference | Later entry than a five-minute model; no guaranteed accuracy advantage |
| 30 minutes | Final at 10:00 | A broader opening observation | May miss an early move and create a wider stop distance |
| 60 minutes | Final at 10:30 | A first-hour reference | Fewer early opportunities; still an intraday definition, not automatically a position strategy |
There is no universally best window for scalpers, day traders or longer holding periods. Compare the same instrument, date range, costs and exit rules before attributing a result to the opening-range duration. A longer window does not automatically make signals more reliable.
Futures trade beyond the U.S. stock cash session. State whether your ORB begins at the cash open or another contract-session boundary. For forex, specify a regional session and timezone; for continuously traded crypto, the “open” is a chosen anchor rather than a market-wide overnight reopening. Account for holidays, early closes, missing bars and delayed opens.
The claim that about 35% of daily highs or lows occur in the first 30 minutes needs a defined market, sample and counting method before it can support a decision. Even a verified early-extreme frequency would not be an ORB win rate: a strategy still needs entries, exits and costs.
Mark the Range on Quant Charts
To mark it manually, identify the first eligible bar, track the maximum high and minimum low until the cutoff, and draw the final boundaries and midpoint. Keep the prior close, prior session range and scheduled announcements as separate context. They should not change today’s range definition after you see the outcome.
The native Opening Range with Breakouts & Targets indicator maps the range, displays breakout arrows and projects target increments as a percentage of range width. Its documented opening-range default is 30 minutes, with an optional custom time span and timezone. It also offers historical display, a directional-bias filter and a session-resetting moving average.
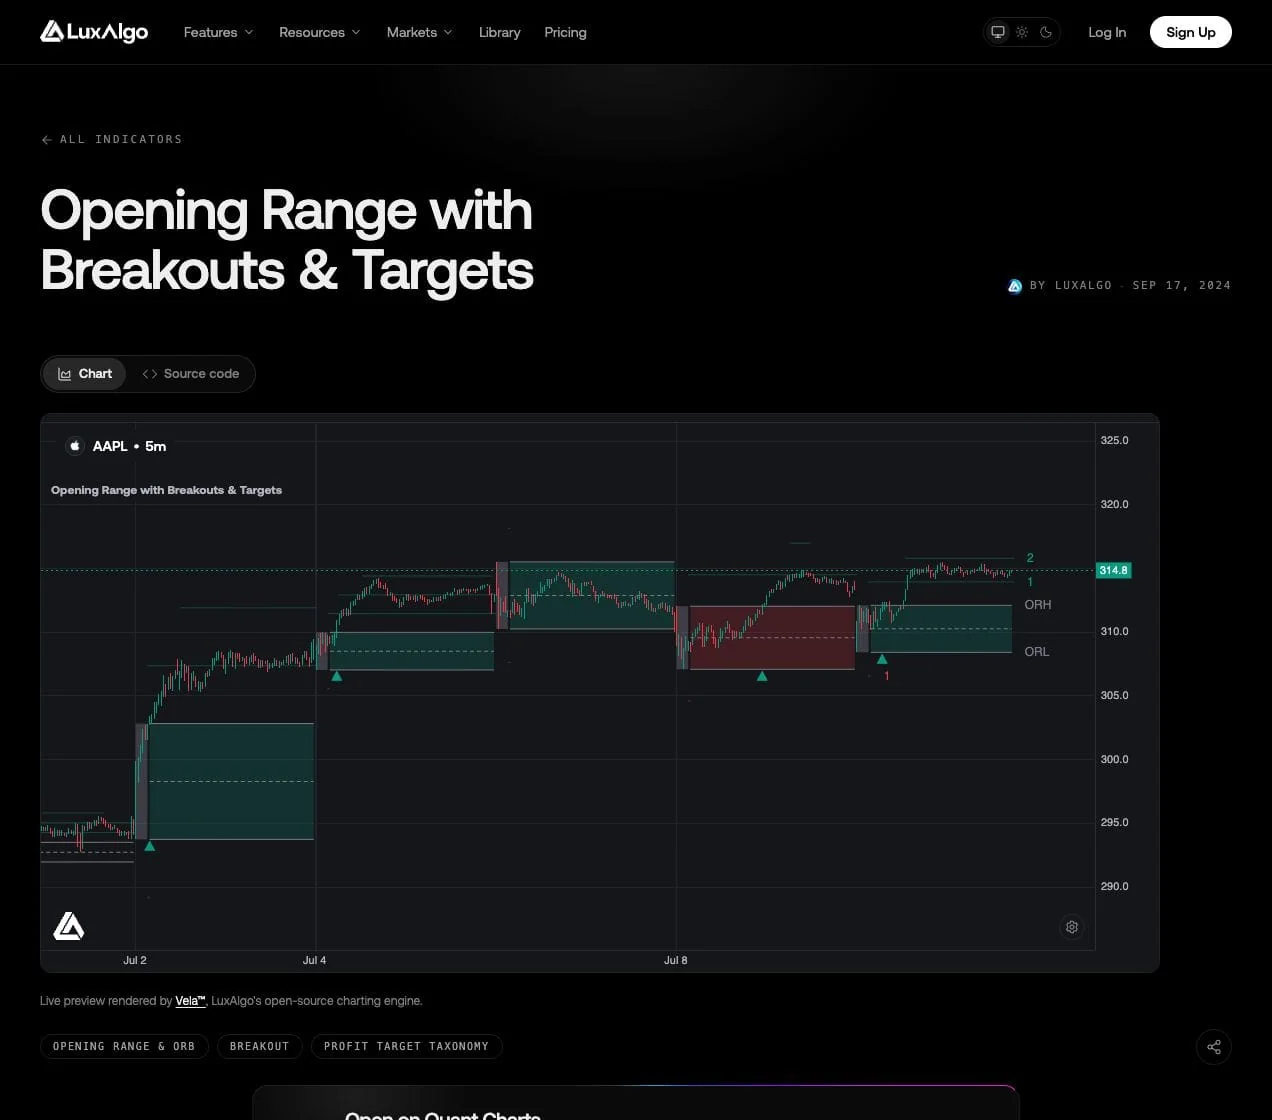
The indicator’s bias option uses today’s range relative to the prior day’s; counter-bias signals wait until the first target in that direction is crossed. Its target-cross reference can use Close or High/Low, and Extended versus Adaptive display changes which target levels are shown. Read the selected settings before interpreting a label: a displayed target is a geometric reference, not a promised fill or probability.
This is a dedicated opening-range product. The Library’s market-structure tools have their own structure and liquidity logic; do not assume they, or any generic range-breakout tool, implement this indicator’s session rules.
Volume-profile analysis can provide another view of activity around the range, but a high-volume node does not guarantee support or resistance. Similarly, market liquidity means available execution and depth; it is not interchangeable with an indicator’s labeled liquidity zones. Assess spread, depth, trade size and data coverage directly.
How to Execute ORB Trades
Specify the Trigger and the Fill
A close-confirmed long model waits for a completed candle above the frozen ORH; a short model waits for a completed candle below ORL. You may require a price buffer, a retest or a volume condition, but each addition changes the strategy. Test them separately instead of treating every form of “confirmation” as equivalent.
For an illustrative AAPL-style range high of $150.25, a close at $150.35 meets an above-high condition. If the next executable price is $150.50, that is the price to use for risk and reward. Comparing breakout volume with the preceding five completed candles can be a specified filter; it does not ensure that the breakout is genuine.
A stop-entry order can trigger intrabar without a closing confirmation, while a retest entry may never fill. A limit order can constrain price but miss the trade. Decide which order behavior the test models, how much delay is assumed and what happens when the market gaps over the intended entry. Do not credit an earlier fill to a signal that was only knowable at the close.
You can define a directional filter such as taking longs only when today’s range is above the previous session’s range and a broader index is trending upward. That is a hypothesis to test, not evidence that every aligned breakout will hold. Use only information available at the decision time, including completed higher-timeframe candles when required.
Stop Placement Does Not Determine Reward-to-Risk by Itself
Common invalidation references include the opposite range boundary, the midpoint or a level just inside the broken boundary. They express different reasons for abandoning the trade. A wider stop allows more adverse movement per unit; a tighter stop can be triggered by a small retest. Neither is inherently conservative once position size is included.
For a hypothetical $48–$50 range, assume a long fill at $50.20 and a target at $54. The following comparison holds entry and target constant so the effect of the stop is visible. The quantity column uses a $500 planned price-risk budget, rounds down to whole shares and excludes costs.
| Stop reference | Stop price | Risk / share | Potential reward / risk | Shares at $500 risk |
|---|---|---|---|---|
| Opposite boundary | $48.00 | $2.20 | $3.80 / $2.20 ≈ 1.73R | 227; $499.40 planned risk |
| Midpoint | $49.00 | $1.20 | $3.80 / $1.20 ≈ 3.17R | 416; $499.20 planned risk |
| Just inside ORH | $49.80 | $0.40 | $3.80 / $0.40 = 9.5R | 1,250; $500 planned risk |
The 9.5R figure is a target-to-stop distance ratio, not a likely return. That tight-stop position has $62,750 of notional exposure at a $50.20 entry, exceeding the example’s $50,000 account before any financing or buying-power constraints. A cash-risk formula must be combined with exposure and liquidity limits.
With a $50.20 fill and a $48 stop, a 2R target is $54.60, not automatically one range width above $50. Stop and target placement must be calculated together. If the trade fills farther from the boundary, recalculate the ratio and quantity or skip it under a predefined rule.
For a separate futures illustration, an ORH of 2,880.25 and ORL of 2,875.75 give a 4.50-point range. If a contract pays $50 per point, a fill at 2,880.50 with a 2,875.75 stop risks 4.75 × $50 = $237.50 per contract before fees and slippage. Two contracts risk $475; three risk $712.50. Check the actual contract’s multiplier and tick size rather than sizing futures like shares.
Stops are not guaranteed maximum losses. Gaps, thin liquidity or fast moves can produce worse fills; a stop-limit order can remain unfilled. Volatility may justify a wider planned stop with fewer units, but widening a live stop while keeping quantity unchanged increases risk.
Trend and exit tools from the Library draw their own levels. Evaluate any displayed exit against the ORB rule; an indicator line does not place or manage a broker stop for you.
Choose an Exit Model You Can Test
- Risk multiples: a $1 entry-to-stop distance and $2 entry-to-target distance give 2R before costs. Record actual average wins and losses, not just the intended target.
- Range projections: with a $2-wide range, a 50% increment equals $1. An upper ladder referenced to a $50 ORH would place the first two levels at $51 and $52. A percentage of range width is not a percentage of account equity or a risk multiple.
- Technical levels: prior swing highs and lows, support/resistance or specified Fibonacci levels can provide candidate exits. Define their anchors without hindsight and assess the distance from the actual entry.
- ATR multiples: 1.5 times a $3.50 ATR equals $5.25 of price distance. State whether the ATR uses daily or intraday bars and where the distance is added or subtracted. A daily volatility measure is not automatically an appropriate same-morning target.
- Trailing exits: specify the activation level and the trail’s exact update rule. Activating after halfway to a target is one testable choice; it does not automatically lock in a profit or improve expectancy.
- Time exits: exiting after two hours, at a defined cutoff or before the session closes creates different models. Include early-close days and do not let a missing target silently turn a day trade into an overnight position.
Partial exits also change the payoff. Selling half at 1R and half at 2R yields 1.5R on the original size before costs, not 2R. If the second half instead exits at the original stop, the combined result is 0R before costs. Keep those outcomes in the trade record.
Testing ORB Filters with Technical Indicators
A filter can improve trade selection in one sample and remove good trades in another. Begin with a clear unfiltered ORB baseline, then add one condition at a time. Compare expectancy, drawdown, trade count and execution costs across an untouched evaluation period; do not choose a filter merely because the surviving chart examples look convincing.
Use Volume with a Defined Comparison
Possible tests include breakout-bar volume above the previous five completed bars’ average, relative volume against the same time on earlier sessions, or a defined volume-profile condition. Early-session volume is often different from midday activity, so the comparison period matters. Volume expansion can accompany a reversal or failed break as well as continuation.
Identify what the feed measures. Quant Charts’ U.S. equities feed reflects Cboe EDGX activity rather than consolidated U.S. volume; crypto volume depends on the selected exchange, and forex activity may use a different representation. A volume threshold calibrated on one feed should not be assumed to transfer unchanged to another. Missing volume should not silently count as confirmation.
Money-flow and divergence readings from the Library’s momentum tools are derived signals; they do not identify institutional buyers or prove that institutions support an ORB. If you use one as a condition, document the exact signal and compare the filtered strategy against the baseline.
Separate Volatility from Direction
Average True Range measures volatility, not bullish or bearish direction. True range is the largest of the current high minus low, the absolute high minus previous close, and the absolute low minus previous close. Wilder’s smoothing is commonly applied over 14 periods.
A 14-period ATR on five-minute bars and a 14-day ATR measure different horizons. If you compare an ATR with its 20-period average, keep the bar interval and calculation timing explicit. Do not call an intraday 20-bar average a 20-day average.
You could test excluding sessions with a very narrow or very wide range relative to a previously completed daily ATR. A low ATR does not guarantee a failed break, and a high ATR does not guarantee follow-through. If using daily ATR during the morning, specify whether it comes from the previous completed day or incorporates the evolving current day; a backtest must not use that day’s eventual full range at 9:45.
For fixed cash risk, larger stop distance means fewer units. A narrower volatility-based stop can imply excessive notional exposure, so cap quantity rather than automatically increasing size in quiet conditions.
Give Momentum and Trend Filters a Specific Role
An RSI condition above 50 and rising for longs, or below 50 and falling for shorts, is one possible momentum rule. A MACD condition, a 20-period EMA trend filter, or a Keltner Channel condition defines a different model. Keltner Channels and Supertrend Channels are not interchangeable products merely because both draw bands.
Several indicators calculated from price may repeat similar information. Specify whether the rule uses an oscillator level, crossover or divergence, and test the incremental contribution. Higher-timeframe alignment must use information available then; a later confirmed trend cannot be assigned retroactively to the opening breakout.
News and earnings can explain unusual activity but also increase gaps, halts and slippage. If the strategy selects stocks using catalysts or premarket volume, preserve the watchlist as it existed before entry. Testing only symbols that later became the day’s biggest movers introduces selection bias.
Risk Management and Trade Optimization
Distinguish Cash Risk, Quantity and Exposure
A 1–2% risk budget is an illustrative convention, not a universal professional standard or a suitable amount for every account. With $50,000, 1% is $500 and 2% is $1,000. At $2 of entry-to-stop distance, those budgets imply 250 and 500 shares before costs. They do not mean investing only $500–$1,000 in the position.
For example, 250 shares bought at $50 represent $12,500 of exposure, or 25% of a $50,000 account. With a $48 stop, planned price risk is $500. A gap fill at $47 loses $750 before fees, so the planned 1% loss becomes 1.5%. Reduce quantity for costs and apply buying-power, concentration and liquidity constraints.
Set a maximum number of attempts and a daily risk budget before the session. Repeated breakouts above and below the same range can create several correlated losses. Simultaneous ORB positions in closely related stocks can also duplicate index exposure even when each individual trade fits its cash-risk limit.
The often-cited 97% loss figure comes from Chague, De-Losso and Giovannetti’s Day Trading for a Living? The study followed people who began day trading Brazilian equity futures in 2013–2015; its abstract reports that 97% of those who persisted for more than 300 days lost money. It is evidence about that cohort, not a measured failure rate for all traders or for this ORB strategy, and it does not by itself attribute the losses to poor risk management.
Plan for Failed Breaks
Closing back inside the range, hitting the chosen stop or failing a retest can each define failure, but they need not happen on the same candle. State which event ends the position and whether another attempt is allowed. A move that eventually resumes in the breakout direction does not erase an earlier stopped-out trade.
Compare performance in trending and ranging periods using a regime definition available at entry. Avoid chasing a breakout once its actual reward-to-risk falls below your rule. If no valid trade appears before the cutoff, staying flat is a valid strategy outcome rather than a missing observation.
A 2R target does not ensure winners compensate for losses. If realized wins average 2R, losses average 1R and there are no costs, break-even occurs at a one-third win rate. At 30% wins, expectancy is 0.30 × 2R − 0.70 × 1R = −0.10R per trade before costs. Slippage and partial exits can change the actual averages.
Turn the ORB Rules into a Reproducible Test
Use Making Strategies with Quant to help implement the session clock, frozen range, confirmation and execution model. Inspect Code, then click Run yourself. In the native backtest, review individual entries and exits as well as the summary. A coded strategy needs verification even when the chart displays plausible arrows.
| Component | Rule to record | Verification question |
|---|---|---|
| Session | Timezone, calendar, start and range cutoff | Does daylight saving or an early close change the intended bars? |
| Signal | Close, touch, buffer or retest; permitted direction | Was the range final and the signal knowable before the fill? |
| Execution | Order model, delay, spread, slippage and fees | Could this price have been traded after the signal? |
| Risk and exits | Stop, size cap, targets, trail and time cutoff | Are partial exits and gaps included in realized results? |
| Evaluation | Fixed baseline, untouched dates and nearby settings | Does the result survive costs and modest parameter changes? |
Pay special attention to bars that contain both a stop and target: OHLC data alone may not reveal which occurred first. Use the tester’s documented execution assumptions and finer data where appropriate. Include losing sessions, no-trade days, failed orders and all instruments that met the original selection rule.
A result from a different strategy template does not validate arbitrary ORB parameters. For a custom ORB, verify the generated strategy’s range construction and trade list rather than assuming any tool automatically tested your exact idea.
Opening Range Breakout Video Walkthrough
The existing tutorial provides another explanation of ORB execution. Treat any demonstrated settings or results as examples to investigate, not proof that the same rules will work on your market and data.
Build an ORB Plan Before the Open
Choose a session and range window, freeze the boundaries when that window ends, and define the signal and executable entry separately. Calculate size from the actual stop distance, then apply exposure and daily risk caps. Test volume, momentum and volatility conditions one at a time and retain the failed breaks in the record.
On Quant Charts, the dedicated opening-range indicator makes those reference levels easier to inspect. Quant can help turn the written rules into a strategy, but the code, timing assumptions and results still need review. A consistent process makes an ORB test interpretable; profitability must be established by evidence.
FAQs
What is the best timeframe for an Opening Range Breakout strategy?
There is no universal best window. Compare five-, 15-, 30- and 60-minute ranges using the same market, costs and exit rules. Keep range duration separate from the chart interval used to evaluate entries.
When should an ORB trade be entered?
After the range is final and the chosen signal has occurred. A candle-close model, intrabar stop-entry model and retest model have different timing and fills; define which one the strategy uses.
Does strong volume eliminate false breakouts?
No. Volume can be tested as a filter, but strong activity can accompany a failed break or reversal. Specify the feed, comparison period and handling of missing volume.
Does an opposite-boundary stop automatically give a 1:1 ratio?
No. Reward-to-risk depends on the actual entry, stop and target together. Calculate both price distances and recalculate after a changed fill.
How can LuxAlgo help build an ORB strategy?
Inspect the dedicated Opening Range with Breakouts & Targets indicator on Quant Charts. Ask Quant to help code explicit session, entry, exit and sizing rules, inspect Code, click Run and review the trade list.
What are common ORB mistakes?
Using an unfinished range, mixing timezones or bar intervals, assuming unrealistic fills, oversizing tight stops, chasing late entries and excluding failed breaks from testing. Record those rules before the session and include costs and all eligible outcomes.
References
LuxAlgo Resources
- Quant Charts
- Opening Range with Breakouts & Targets
- LuxAlgo Quant
- Making Strategies with Quant
- Native Backtest Guide
External Resources
Read next