Head and Shoulder Pattern- New Neckline Tricks
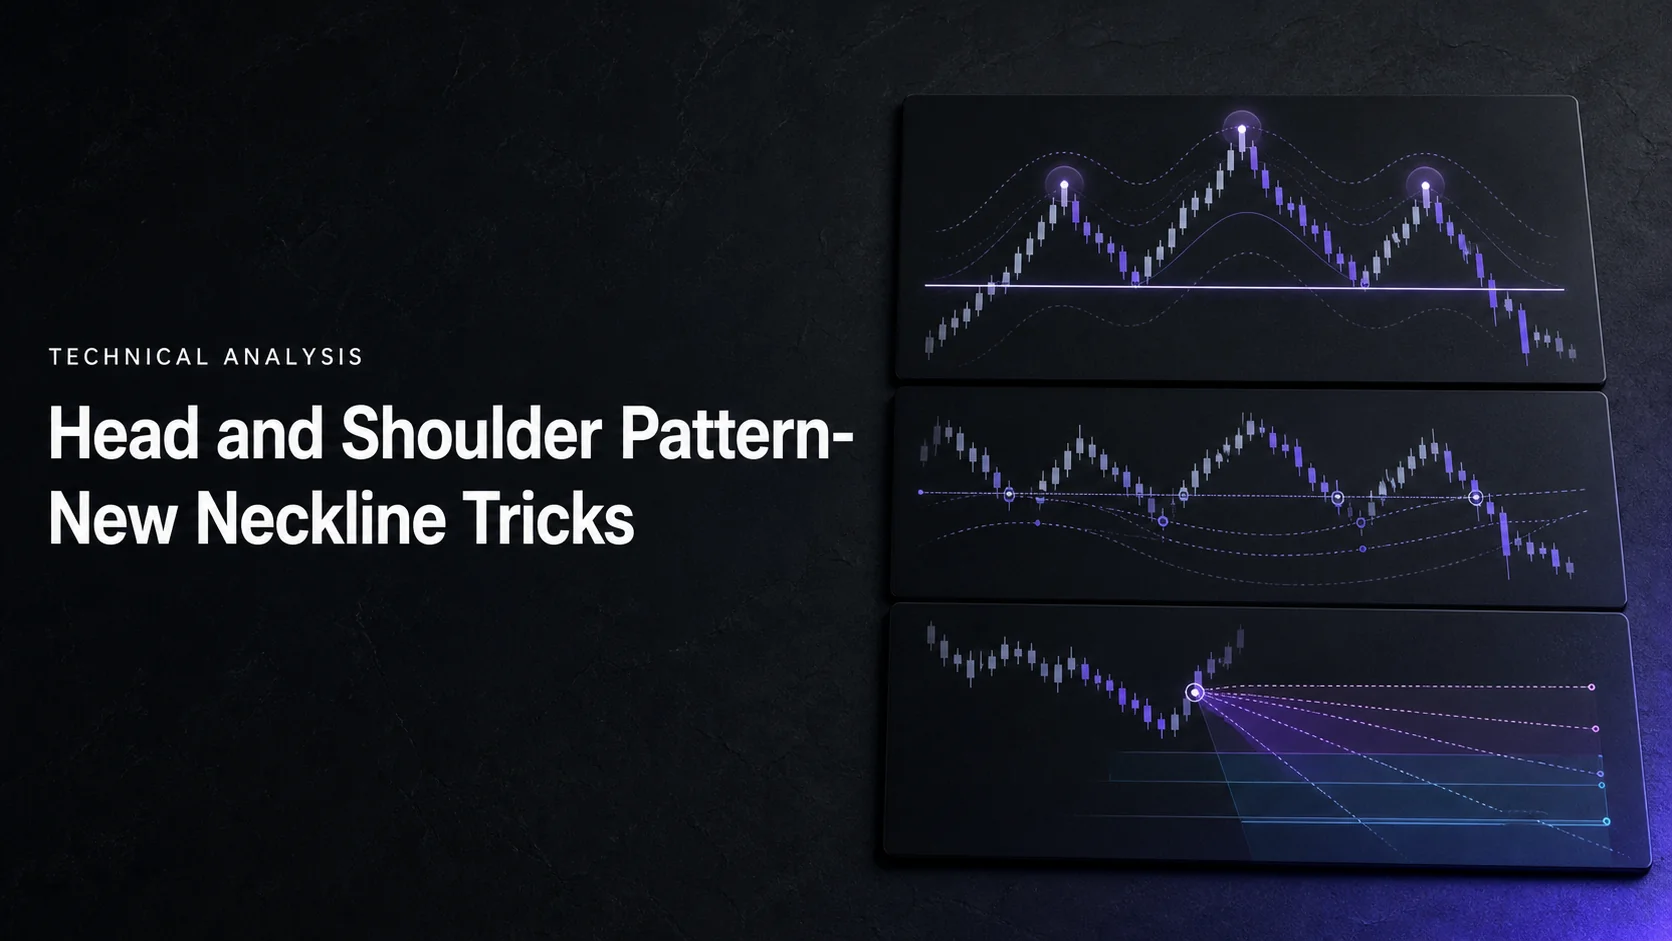
The neckline turns a head-and-shoulders outline into a specific level to monitor. For a top, it joins the two reaction lows between the shoulders and head; for an inverse pattern, it joins the corresponding reaction highs. A forming pattern and a completed neckline break are different events.
This guide explains horizontal and sloping necklines, then shows how EMA, volume and Fibonacci filters can be tested around them. Use LuxAlgo’s charting and AI platform to inspect the structure on Quant Charts and work with Quant, our coding agent, to implement explicit rules. Additional indicators do not guarantee a successful reversal.
Basic Neckline Principles
A head-and-shoulders top follows an uptrend and has three peaks, with the head higher than the shoulders. An inverse pattern follows a downtrend and has a deeper central trough. Similar shoulder heights can help recognition, but perfect symmetry is not required.
The StockCharts top-pattern guide and inverse-pattern guide describe the reaction points, neckline break and measured objective. A shape without the preceding trend or a qualifying break should not automatically be counted as a completed reversal.
Three Main Neckline Types
| Neckline | Top-pattern geometry | Practical consequence |
|---|---|---|
| Horizontal | Two reaction lows at similar prices | The reference level changes little over time |
| Ascending | Second reaction low above the first | The projected support level rises as the pattern develops |
| Descending | Second reaction low below the first | The projected support level falls; a later break may leave less room to the target |
For an inverse pattern, use reaction highs rather than lows to define the neckline. All three orientations are possible. A slope is a geometric property, not a universal win-rate ranking: horizontal does not mean guaranteed reliability, and ascending does not automatically mean invalid.
Record the two anchor bars, the price basis and the chart scale. Use wick extremes or another consistent rule rather than changing the anchors to make a failed setup look better. Drawing the neckline on a logarithmic chart is not equivalent to straight price-per-bar interpolation on a linear scale.
Calculate the Level at the Relevant Bar
On a linear chart, suppose reaction lows are $100 at bar 10 and $102 at bar 20. The neckline rises $0.20 per bar. Its projected value at bar 30 is $104. A completed close at $103.50 is below that projected line even though it is above both original lows.
State whether your method continues extending the line after the break or freezes the break level. That choice changes retest and failure rules. Do not move the target or invalidation level simply because a different projection makes the trade look more attractive.
Separate Breaks, Retests and Failures
An intrabar cross and a completed close are different triggers. Waiting for a close can remove some temporary breaches, but it can also delay entry. A retest may provide another entry opportunity, yet price may never return or may reclaim the neckline.
Define failure in advance—for example, a specified number of closes back through the broken neckline or a close beyond the right shoulder. A later move in the expected direction does not erase an earlier stop or invalidation.
EMA, Volume and Fibonacci Filters
Use EMAs Alongside the Structural Neckline
A 20-period or 50-period exponential moving average smooths price; it does not connect the pattern’s reaction points. Calling it an “EMA-based neckline” can hide that distinction. Treat an EMA condition as a separate trend or timing filter while retaining the actual neckline.
For example, a bearish model could require a neckline close-through while price is below a 20-period EMA. A different model might require the 20-period EMA below the 50-period EMA. Both are testable conditions, but neither is automatically best for a particular holding period.
EMAs lag price, and several moving-average conditions may express similar information. Compare the pattern alone against each added filter using the same sample and costs. An apparent reduction in false signals must be measured alongside missed trades and later entries.
Keep Volume Measurements Distinct
| Measure | What it describes | What to specify |
|---|---|---|
| Volume per candle | Activity over time | Feed, session and comparison average |
| OBV | Cumulative volume added or subtracted according to close direction | Divergence or trend rule and evaluation window |
| VWAP | Volume-weighted average price | Session reset or anchor and price basis |
| Volume profile | Activity grouped by price | Profile range and price bins |
These tools do not independently certify a neckline break. A VWAP crossing is not a volume surge, and a high-volume profile node is not evidence that the breakout candle expanded relative to prior candles.
Traditional top-pattern analysis often watches for reduced participation near the head or right shoulder and renewed activity on the decline. For an inverse pattern, expansion on advances and the upward break receives particular attention. Do not simply reverse a fixed left-shoulder/head/right-shoulder volume sequence.
On a EUR/USD chart, identify whether volume represents ticks or another feed-specific measure before comparing it with stock or exchange-specific crypto volume. A rule such as “20% above the previous 20-bar average” is a parameter to evaluate, not proof of a genuine break. Exclude the current bar from the comparison average if that is how the rule is defined.
Use Independent Fibonacci Anchors
Fibonacci retracements can supply additional reference levels around an independently drawn neckline. State the swing high and low used to anchor the retracement and keep them fixed for the test. Drawing from the head to the neckline and then declaring the endpoint confirmed by the same drawing is circular.
The 38.2% and 61.8% ratios are commonly used Fibonacci retracements; 50% is also a common retracement reference, although it is not a Fibonacci-derived ratio. A nearby level is confluence to investigate, not mathematical proof that price will reverse there.
For a hypothetical crypto swing from $100 to $140, a downward retracement of 38.2% reaches $124.72, 50% reaches $120 and 61.8% reaches $115.28. If a separately anchored neckline is nearby, define the allowed distance before reviewing outcomes. Do not select a new swing solely to manufacture a match.
Compare Filters Instead of Stacking Assumptions
Test the structural break first, then compare EMA, volume and Fibonacci conditions individually and in the combinations you intend to trade. Keep an untouched evaluation period. A small set of selected winners cannot support a universal claim that combined filters improve accuracy or reward-to-risk.
Targets, Stops and a Worked Example
Specify the Missing Neckline
A head price and right-shoulder price alone cannot determine a measured objective. You also need the neckline and the measurement convention. For a historical SPY study, record dates, adjusted prices, anchor bars and the first actionable break before attributing an outcome to the pattern.
Consider a clearly hypothetical SPY-shaped example with a $162 head and a horizontal $150 neckline. The pattern height is $12, so the basic downside projection is $138. This is a planning reference; it does not establish that SPY traded this sequence on any particular date.
If a short entry occurs at $149 and an independently chosen stop is $155, planned risk is $6 per share and potential reward to $138 is $11, about 1.83R before costs. A $20,000 account using an illustrative 0.5% cash-risk budget has $100 available: 16 shares risk $96 and represent $2,384 of notional exposure.
A cover at $155 loses $96 before costs. Covering after a gap to $158 loses $144. The percentage budget is an example, not a universal recommendation, and equity short sales also involve borrow availability, borrowing costs and margin.
Match the Stop to the Entry Hypothesis
A stop above the right shoulder tests the broader top-pattern premise. A stop above a retest high may test a narrower entry. Choose the invalidation rule first; do not move the stop artificially close just to reach a desired ratio. For an inverse setup, the corresponding references are below the shoulder or retest low.
Measure reward from the actual fill. For a sloping neckline, specify whether the head-to-line distance is taken at the head’s bar and projected from the break, or whether another documented convention is used. Include nearby support or resistance that could interrupt the measured move.
A trailing indicator line is not a broker order. Stops may execute worse than expected during gaps or fast markets, and a completed backtest does not eliminate that risk.
Review Necklines with LuxAlgo
Use the Current Library Implementation
The Head & Shoulders Library indicator detects tops and inverse bottoms from confirmed swings. Its current documentation separates a forming pattern from the completed close through the neckline, then distinguishes retests, failures and measured objectives.
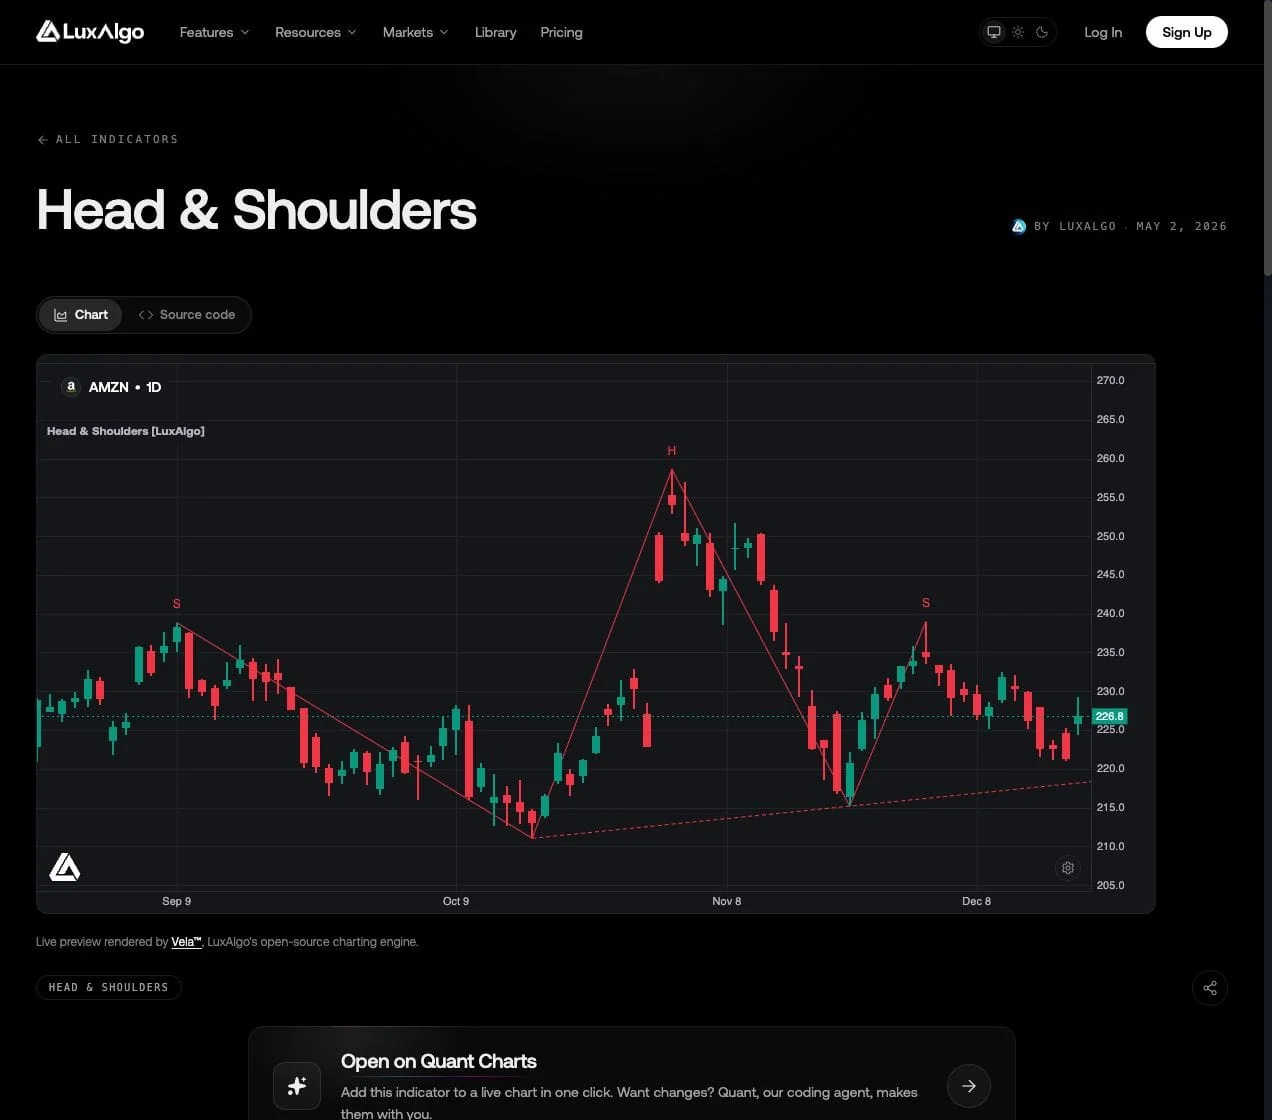
Documented defaults include a swing length of 10 bars on each side of a pivot, a 100-bar completion window and two reclaim closes for failure. A pivot requiring future bars becomes known only after confirmation; a backtest must not act as though it was known at the original turning point.
The implementation checks prior trend, shoulder symmetry and neckline tilt. It can flag low-volume breaks relative to a 20-bar average, so a label should not be interpreted as a guarantee of volume confirmation. Review the current settings and event definitions before adapting the code.
Inspect the Anchors on Quant Charts
Open the indicator on Quant Charts and inspect the symbol, timeframe and neckline anchors. Use drawings to compare the detector’s line with your chosen manual convention. Changing the interval changes the swing sequence and may change whether a pattern qualifies.
Keep Order-Block Context and Neckline Rules Separate
The Library’s market-structure and order-block tools can provide context around a neckline on a Quant Chart, but an order-block zone does not prove that a break is imminent. An alert and a filled trade are separate events.
Turn the Comparison into a Test with Quant
Ask Quant, our coding agent, to help implement the anchor rule, completed-close trigger, retest window, failure condition, stop and target. Add EMA, volume or Fibonacci filters explicitly rather than asking for an undefined “high-probability neckline.”
Follow Making Strategies with Quant: inspect the generated code and click Run yourself. Use the native backtest guide to review fills, costs, drawdown and average outcomes.
Compare both successful and failed formations using the same data, settings and execution assumptions. Claims such as a 15% reduction in false signals require a reproducible dataset and definition; they cannot be inferred from adding an EMA or selecting an attractive chart.
Head-and-Shoulders Video Example
A More Precise Neckline Process
Anchor the structural neckline first, distinguish a forming pattern from a completed break, and evaluate additional filters separately. Use Quant Charts to inspect the geometry and Quant to help test the rules. Measure risk from the actual entry and retain failures in the analysis.
FAQs
Can an EMA replace a head-and-shoulders neckline?
An EMA smooths price and can be a separate trend filter. The structural neckline connects the pattern’s reaction points; replacing it creates a different strategy definition.
Which neckline slope is most reliable?
There is no universal win-rate ranking. Horizontal, ascending and descending lines change the trigger geometry and available reward. Compare them under explicit rules on the relevant dataset.
Does volume guarantee a valid neckline break?
No. Volume can support a defined filter, but a surge does not guarantee follow-through. Inverse patterns traditionally emphasize expansion during advances and the upward break.
How should Fibonacci levels be used?
Choose independent swing anchors and a preset proximity rule. A nearby retracement level is a condition to test, not proof of a reversal or a reason to move the neckline.
Is a retest required before entry?
Only if your strategy requires it. Breakdown-close and retest entries are different models, and a retest may never occur or may reclaim the broken level.
How does LuxAlgo help analyze necklines?
The Library indicator separates forming, break, retest and failure events. Inspect it on Quant Charts and use Quant to help implement explicit tests, then review the code and results yourself.
References
LuxAlgo Resources
- Quant Charts
- Head & Shoulders Indicator
- LuxAlgo Quant
- Making Strategies with Quant
- Native Backtest Guide
External Resources
Read next