Keltner Channel Strategy: Surfing the Volatility Bands
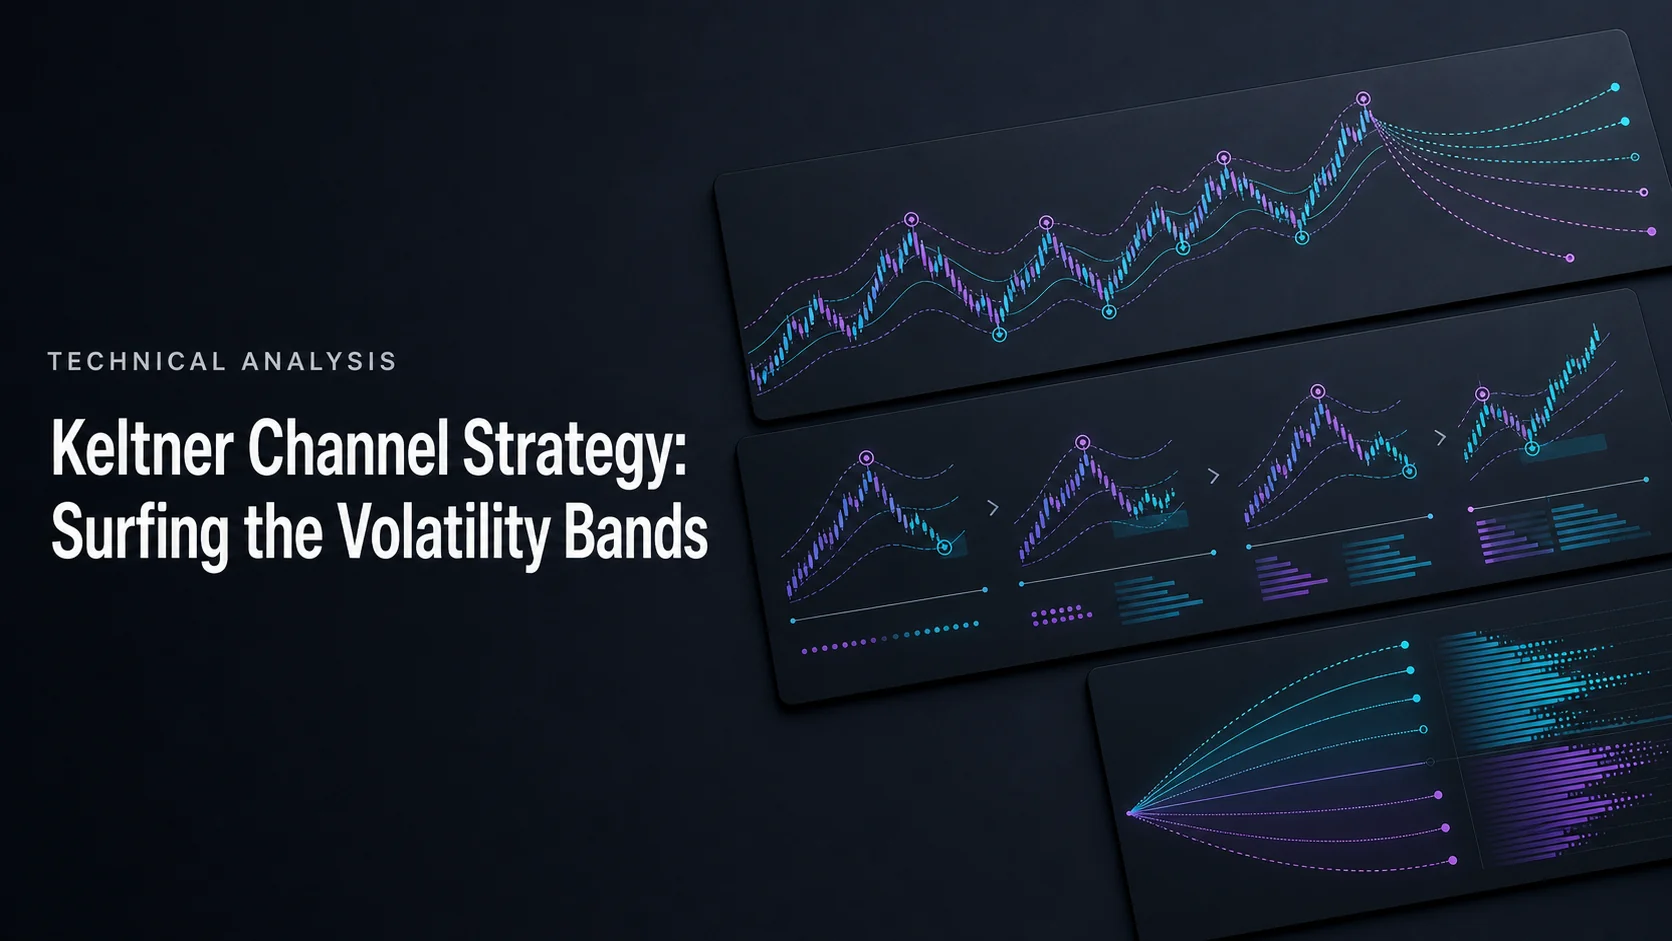
A Keltner Channel places a moving average between two range-based bands. It can help frame breakout, pullback, and mean-reversion strategies, but the same band touch can mean different things under different rules. Choose the strategy before interpreting the signal.
Use LuxAlgo’s native charts to compare price with the channel, then work with Quant to build and test explicit entries, exits, and sizing. Treat the channel as a reference for research rather than a promise that price will respect its boundaries.
Define the Keltner Channel You Are Using
A common modern version uses an exponential moving average and ATR-based offsets. For an illustrative 20-period EMA and factor of 2:
- Middle line = 20-period EMA.
- Upper band = EMA + 2 × ATR.
- Lower band = EMA − 2 × ATR.
The ATR length is a separate input from the EMA length. Some implementations allow a simple moving average or high-low range instead of ATR, so record the actual settings. TradingView’s Keltner reference explains those choices and the modern variation on Chester Keltner’s original channel.
With a middle line of $100 and ATR of $2, a factor of 2 places the bands at $104 and $96. The full channel width is $8. These are price-distance calculations, not statistical confidence limits: they do not establish that a particular percentage of future prices will remain inside the bands.
Band width reflects the chosen range measure. It can increase during a move in either direction. The moving average’s slope describes its recent direction, but it does not guarantee that the trend will continue.
Choose One of Three Strategy Types
| Approach | Candidate setup | Rule that needs testing |
|---|---|---|
| Breakout | Price closes beyond an outer band | Whether the move continues after the actual entry fill |
| Trend pullback | Price returns toward the average within a defined trend | What confirms the pullback has ended |
| Mean reversion | Price extends toward a band in a defined range | What confirms re-entry and invalidates the range |
Breakout Trading
One hypothetical long rule is to enter after a completed bar closes above the upper band. Define whether it must be the first such close, whether the middle line must be rising, and when the entry order is submitted. A next-bar market entry should use an executable next-bar fill assumption rather than the previous band value.
A resting buy stop at a previously calculated band is a different rule: it may trigger before the bar closes, while the current band itself can change. Keep confirmed-close and intrabar variants separate in the test. For short entries, mirror the logic with the appropriate order type and contract assumptions.
Trend Pullbacks
A pullback setup might require the middle line to be higher than its value a specified number of bars earlier, followed by a retracement toward that line. Define the entry trigger independently, such as a completed recovery above a prior bar’s high. Merely touching the average does not confirm that a pullback has ended.
Specify where the idea becomes invalid. A swing low, a fixed-at-entry ATR distance, and a moving channel band produce different stops. Select one rule for the experiment and keep the sizing consistent with its risk distance.
Mean Reversion
A range-based approach can investigate whether an extension beyond a band followed by a confirmed return inside offers a useful entry toward the average. Define the range filter using information available before entry, and state when a breakout cancels the idea.
This is not the same as selling every upper-band touch or buying every lower-band touch. Persistent trends can remain outside a channel. Conversely, a flat market does not automatically invalidate every channel strategy; it changes which hypothesis you are testing.
Choose Settings Without Fitting Every Past Move
Record the price source, average type and length, ATR length and smoothing, multiplier, symbol, session, and interval. A configuration such as EMA 20, ATR 10, and factor 2 is a baseline to compare, not a universal optimum.
A wider multiplier places the boundary farther from the average. It changes which moves qualify and how late an entry may occur; it does not guarantee fewer losing trades. A longer average changes the balance between smoothing and responsiveness. Test a limited set of alternatives chosen before seeing the final results.
For multiple timeframes, use only information available at the decision point. A completed daily channel cannot retrospectively confirm an earlier hourly trade if that daily candle was still forming. Keep each timeframe’s role explicit instead of assuming that more charts provide more independent evidence.
Calculate Risk From the Trade, Not the Channel’s Appearance
Suppose a hypothetical long breakout fills at $104.50 and your predefined invalidation stop is $101.50. Initial price risk is $3 per share. A fixed target at $110.50 offers $6 per share, or a planned 2-to-1 reward/risk ratio before costs and fill differences.
With a $300 risk budget and a $0.10 per-share cost allowance, quantity is floor($300 / $3.10) = 96 shares. Planned loss including that allowance is $297.60. If the entry instead fills at $105 while the stop and target stay unchanged, price risk rises to $3.50 and potential reward falls to $5.50. Recalculate rather than keeping the original ratio on paper.
A stop halfway between two channel lines does not automatically provide balanced risk and reward. Nor is the opposite band always appropriate: it may put the stop much farther away than the trade can support. Use a defined invalidation rule and size from it. CME’s sizing guidance explains the relationship.
If the channel moves during the trade, specify whether your target or stop follows it. Do not quietly widen a protective stop because the bands expand. Gaps and slippage can also exceed planned risk, as described in the SEC’s stop-order bulletin.
Build and Compare the Rules With Quant
Describe one strategy type to Quant, including the channel formula, entry timing, stop, target, and sizing. Review the generated logic and inspect example trades around band crossings, gaps, and bars that touch both a stop and a target. Do not assume a favorable intrabar sequence when the available data cannot establish it.
The free Chandelier Exit Oscillator is an optional tool to explore alongside the channel. It expresses price relative to ATR-based trailing levels as an oscillator and offers an overlay for the stop references. That is a different calculation from a Keltner band, and neither indicator manages a broker order by itself.
Compare the baseline with one added filter or exit change at a time. Include commission, slippage, and the intended position sizing. Assess drawdown, average outcome, trade count, and exposure alongside net profit; a high win rate alone does not establish a profitable system.
Reserve later data for validation and compare nearby parameters. There is no universal six-month period that proves robustness. A test needs enough relevant observations and contrasting market conditions for the question being asked. Our out-of-sample testing guide explains how to separate selection from evaluation.
Keltner Channels Versus Bollinger Bands
The modern Keltner version discussed here uses ATR-based width, whereas Bollinger Bands use price dispersion around an average. Their responses depend on the selected lengths, smoothing, and market path. That difference does not make one universally better for long-term trends or the other inherently better for short-term reversals.
If comparing them, keep the entry family, risk, costs, and test periods aligned. John Bollinger’s rules also caution against treating a band tag as a standalone buy or sell signal.
Video: Keltner Channel Trading Strategy
Mind Math Money explains Keltner Channels and compares them with Bollinger Bands. Use the tutorial to understand the visual setup, then evaluate the specific entry and exit rules you intend to trade.
FAQs
How can I customize the Keltner Channel to match my trading strategy or adapt to different market conditions?
Record the average type and length, ATR calculation, multiplier, price source, and chart interval. Compare a documented baseline with a small set of alternatives, including costs and a later validation period. There is no universally best configuration.
What are some common mistakes traders make with Keltner Channels, and how can I avoid them?
Avoid treating every band touch as a reversal, mixing intrabar and close-confirmed entries, and assuming a channel-based stop guarantees a particular risk/reward ratio. Define the strategy, order timing, invalidation, and sizing before testing.
How do Keltner Channels differ from Bollinger Bands when it comes to identifying trends and volatility?
The modern Keltner version uses ATR-based offsets, while Bollinger Bands use price dispersion around an average. Compare the actual settings and behavior under the same test conditions rather than assuming one is always better for trends or reversals.
Read next