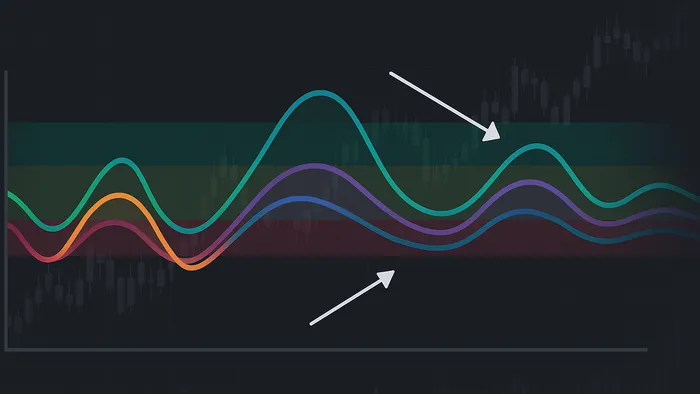

Explore the Ultimate Oscillator, a powerful momentum indicator that combines multiple timeframes for better trading insights across various markets.
The Ultimate Oscillator is a momentum indicator that blends three timeframes—short (7 periods), medium (14 periods), and long (28 periods)—into a single value. This multi-timeframe approach helps traders identify overbought (above 70) and oversold (below 30) conditions with greater accuracy, reducing false signals common in single-timeframe indicators. It assigns more weight to recent price action (4:2:1 ratio), ensuring a balance between short-term fluctuations and long-term trends.
Key benefits include:
- Improved reliability in volatile markets by smoothing out short-term noise.
- Versatility across asset classes like equities, forex, and commodities.
- Divergence signals for spotting potential trend reversals.
The calculation uses buying pressure (BP) and true range (TR) across the three timeframes, producing a value on a 0–100 scale. While effective on its own, LuxAlgo provides enhanced TradingView tools like automated divergence detection and AI Backtesting. This makes the Ultimate Oscillator a practical choice for traders seeking clearer momentum insights.
Best Indicator To Trade Multiple Time Frame Divergences | Ultimate Oscillator Forex & Stock Strategy
How the Ultimate Oscillator Is Calculated
The Ultimate Oscillator relies on a combination of buying pressure and true range across three distinct timeframes. By blending these elements, traders gain a clearer picture of market trends, balancing short-term movements with longer-term momentum.
Breaking Down the Formula
The calculation for the Ultimate Oscillator integrates three weighted averages into one value:
Ultimate Oscillator = 100 × [(4 × Average7) + (2 × Average14) + Average28] / 7.
This formula emphasizes recent price activity while still factoring in broader trends. Here's how it works:
-
Buying Pressure (BP): This measures upward price movement by comparing the closing price to the lowest value between the current low and the previous close:
BP = Close – Min(Low, Previous Close). -
True Range (TR): This captures the overall price movement by measuring the distance between the highest and lowest points:
TR = Max(High, Previous Close) – Min(Low, Previous Close). For foundational context on this concept, see this overview of true range in technical analysis.
Each timeframe’s ratio of buying pressure to true range is calculated and then weighted. The 7-period average gets the most weight (4), followed by the 14-period average (2), and finally the 28-period average (1). This weighting system ensures that recent trends hold more influence, while longer-term movements provide additional context.
The final value is scaled to a range of 0–100 by multiplying the weighted average by 100. Adjusting the timeframes can further refine the calculation for specific markets or assets.
Tailoring Timeframes for Different Markets
While the default settings of 7, 14, and 28 periods suit many U.S. markets, different assets often require customized timeframes to reflect their unique trading dynamics.
- Cryptocurrencies: Due to their fast-paced nature, shorter timeframes like 3, 7, and 14 periods are often used. These settings help capture rapid momentum shifts that can occur within hours.
- Commodities: Markets like energy and agriculture typically benefit from longer timeframes, such as 14, 28, and 56 periods. These settings help smooth out daily fluctuations and focus on broader supply and demand trends.
- Forex Pairs: For currency pairs involving the U.S. dollar, slightly adjusted periods like 5, 10, and 20 align better with the weekly trading cycle. This accounts for 24-hour trading and global market sessions.
Example Calculation
Let’s take a hypothetical week of stock price data to see the Ultimate Oscillator in action:
| Day | High | Low | Close | Previous Close | BP | TR |
|---|---|---|---|---|---|---|
| 1 | $10.50 | $9.80 | $10.20 | $10.00 | $0.40 | $0.70 |
| 2 | $10.80 | $10.10 | $10.60 | $10.20 | $0.50 | $0.70 |
| 3 | $11.00 | $10.40 | $10.90 | $10.60 | $0.50 | $0.60 |
| 4 | $11.20 | $10.70 | $11.10 | $10.90 | $0.40 | $0.50 |
| 5 | $11.50 | $10.90 | $11.30 | $11.10 | $0.40 | $0.40 |
| 6 | $11.70 | $11.10 | $11.50 | $11.30 | $0.40 | $0.40 |
| 7 | $11.90 | $11.30 | $11.70 | $11.50 | $0.40 | $0.40 |
On Day 1, the buying pressure is calculated as $10.20 − $9.80 = $0.40. The true range is $10.50 − $9.80 = $0.70. Similarly, Day 2 shows stronger buying pressure at $0.50, with the same true range of $0.70.
To compute the 7-period average:
- Total BP = $0.40 + $0.50 + $0.50 + $0.40 + $0.40 + $0.40 + $0.40 = $3.00.
- Total TR = $0.70 + $0.70 + $0.60 + $0.50 + $0.40 + $0.40 + $0.40 = $3.70.
The 7-period ratio is then $3.00 ÷ $3.70 = 0.811. Similar calculations for the 14 and 28 periods, when weighted and combined, produce the oscillator’s final value. In this example, steady buying pressure combined with decreasing volatility suggests growing bullish momentum.
Reading Signals: Overbought/Oversold and Divergences
The Ultimate Oscillator provides trading signals through overbought/oversold levels and divergence patterns, often hinting at potential market reversals. Understanding these signals can help traders pinpoint entry and exit opportunities. However, combining these signals with other indicators is essential for making well-informed trading decisions.
Overbought and Oversold Levels
The Ultimate Oscillator operates on a scale of 0–100, offering insights into market extremes. Readings above 70 signal overbought conditions, while values below 30 indicate oversold levels. A midpoint reading of 50 represents the dividing line between bullish and bearish market sentiment. Numbers above 50 suggest a bullish inclination, while those below 50 imply a bearish tendency [2][5].
"When the Ultimate Oscillator reaches a level above 70, this is considered overbought, and a sell signal may be generated. Conversely, when the Ultimate Oscillator reaches a level below 30, this is considered oversold, and a buy signal may be generated." — TrendSpider Learning Center [1]
Buy and sell signals occur when the oscillator crosses these thresholds. For example, a buy signal forms when the oscillator dips below 30 and then climbs back above, while a sell signal emerges when it rises above 70 and subsequently falls back below [4].
That said, traders should be cautious in strongly trending markets. During powerful uptrends, the oscillator might stay above 70 for extended periods, while in prolonged downtrends, it can remain below 30. In such situations, relying solely on these levels could lead to premature trades [5].
For assets that rarely hit the standard 30/70 thresholds, adjusting the oscillator’s parameters can improve its accuracy. Volatile stocks might benefit from shorter timeframes (e.g., 4, 8, and 16 periods) to enhance sensitivity, while less active securities may require longer periods to minimize noise [2][3]. This multi-timeframe approach helps refine signals, filtering out misleading price fluctuations.
Next, let’s explore how divergence patterns can act as additional early-warning signals.
Bullish and Bearish Divergences
Divergence patterns provide valuable insights beyond fixed thresholds. Divergences occur when price action and the Ultimate Oscillator move in opposite directions, signaling potential shifts in market momentum.
A bullish divergence happens when prices make lower lows, but the oscillator forms higher lows. This suggests that while prices are declining, underlying buying pressure is strengthening. The oscillator’s inability to confirm new price lows hints at weakening selling momentum, signaling a possible upward reversal.
On the other hand, a bearish divergence forms when prices hit higher highs, but the oscillator registers lower highs. This indicates that while prices continue to rise, the momentum driving the increase is fading. The oscillator’s failure to match price strength points to diminishing buying pressure, raising the likelihood of a downward correction.
| Divergence Type | Price Action | Ultimate Oscillator | Market Implication | Confirmation Signal |
|---|---|---|---|---|
| Bullish | Lower lows | Higher lows | Selling pressure weakening | Break above recent resistance |
| Bearish | Higher highs | Lower highs | Buying momentum fading | Break below recent support |
Confirmation is critical when acting on divergence signals. For instance, a bullish divergence gains credibility if the price breaks above a recent resistance level, while a bearish divergence is more reliable when the price drops below nearby support. Without confirmation, divergences can lead to false signals and premature trades.
The multi-timeframe design of the Ultimate Oscillator makes its divergence signals more dependable compared to single-timeframe indicators. By using 7, 14, and 28-period momentum, the oscillator filters out short-term noise, reducing the risk of false divergences.
Traders should also be aware of hidden divergences, which, although less common, can signal trend continuation. For example, a hidden bullish divergence appears during an uptrend when the price makes higher lows, but the oscillator records lower lows. This indicates that the existing uptrend may persist with renewed strength.
Using the Ultimate Oscillator in U.S. Markets
The Ultimate Oscillator is a versatile indicator for navigating the complexities of U.S. markets. Its multi-timeframe approach caters to the unique dynamics of various trading instruments, from high-frequency equities to longer-term commodities. Knowing how to apply this indicator in different scenarios can make a significant difference in trading decisions.
Using the Indicator in Trend Confirmation
One of the most effective uses of the Ultimate Oscillator in U.S. markets is trend confirmation. Traders often rely on it to verify trends by checking whether the oscillator stays above or below the 50 level during peak trading hours.
For highly volatile equities, like NASDAQ technology stocks, the oscillator’s three-timeframe structure (7, 14, and 28 periods) helps filter out misleading signals. This design ensures momentum aligns across multiple timeframes, offering a clearer picture of the trend.
In commodities like oil futures, the indicator shines by highlighting sustained uptrends. Consistently higher lows on the oscillator indicate steady buying pressure, even when short-term corrections occur.
The indicator is equally effective in downtrends. When the oscillator remains below 50, it confirms bearish momentum. Brief rallies above 70 during a downtrend often signal opportunities to short. If the oscillator fails to reach overbought levels during a downtrend, it suggests growing selling pressure, hinting that the trend may persist longer than anticipated.
Avoiding False Signals in Volatile Markets
Range-bound markets are notoriously tricky for momentum indicators, but the Ultimate Oscillator is designed to handle these challenges. U.S. markets often experience consolidation during holidays or the summer, when institutional activity slows down.
In sideways price action, traditional single-timeframe oscillators tend to produce false signals as prices repeatedly test support and resistance levels. However, the Ultimate Oscillator’s multi-timeframe calculation smooths out these fluctuations, reducing the risk of being misled.
The indicator also proves its worth during intraday volatility spikes, which are common around major economic announcements or Federal Reserve meetings. Many momentum indicators react prematurely to these events, but the Ultimate Oscillator’s longer calculation periods help traders avoid hasty decisions.
At market open, when stocks often gap up or down, single-timeframe indicators can yield unreliable overbought or oversold readings. The Ultimate Oscillator accounts for these gaps within a broader momentum framework, providing more accurate signals.
Additionally, the oscillator’s multi-timeframe approach helps distinguish genuine momentum shifts from temporary price moves caused by market makers or algorithmic trading. This refinement makes it a practical indicator across various U.S. market conditions.
Market Examples
The Ultimate Oscillator’s ability to adapt to different market conditions makes it a reliable choice across a wide range of U.S. trading scenarios.
- Large-cap technology stocks often demonstrate the indicator’s strengths. In major uptrends, these stocks typically maintain oscillator readings above 50 for extended periods, with brief dips below 30 offering potential entry points.
- Energy sector trading, particularly in oil and gas stocks, benefits from the oscillator’s ability to differentiate between minor corrections and true momentum reversals. These stocks often follow trends influenced by commodity prices and geopolitical factors.
- Small-cap equities are known for their erratic price movements, which can generate false signals in other indicators. The Ultimate Oscillator’s smoothing effect helps filter out noise, making it easier to spot genuine momentum shifts.
- Index trading, such as with the S&P 500 and NASDAQ Composite, showcases the indicator’s dependability. Indices tend to have cleaner price action than individual stocks, allowing the oscillator’s signals to stand out. Its multi-timeframe design provides clear trend confirmation and reversal cues.
- Currency pairs involving the U.S. dollar, like EUR/USD and GBP/USD, also respond well to the Ultimate Oscillator. These pairs often trend for extended periods, and the oscillator helps traders pinpoint when momentum is building or fading.
Improving the Ultimate Oscillator with LuxAlgo on TradingView

The Ultimate Oscillator is already strong for analyzing momentum across multiple timeframes. When combined with LuxAlgo’s exclusive TradingView tools—such as toolkits and automated features—it becomes even more powerful. LuxAlgo enhances this strategy with features like real-time divergence detection, AI Backtesting, and multi-timeframe integration, making it easier for traders to adapt to changing market conditions.
Instead of relying solely on manual analysis, LuxAlgo provides automated workflows that help traders interpret signals more efficiently while preserving flexibility to adjust for different market scenarios.
Using LuxAlgo’s Oscillator Matrix
One standout capability available on TradingView is the Oscillator Matrix, designed to streamline and refine momentum analysis.
The Oscillator Matrix simplifies how traders use indicators like the Ultimate Oscillator. It automatically detects divergences, reducing the time spent manually scanning charts. By combining multiple oscillator readings into one clear interface, the Matrix provides a comprehensive view of momentum signals.
When the Ultimate Oscillator suggests a potential reversal, the Matrix cross-checks this with volume-based confirmations and trend-following algorithms. This layered approach helps reduce the risk of false signals—a common issue with single-indicator strategies.
One of its most useful features is automatic divergence detection, which highlights when price action and oscillator momentum are out of sync. This is especially helpful in fast-paced markets like tech stocks or USD-based forex pairs, where quick decisions are crucial.
Additionally, the Matrix incorporates volume-based analysis, offering a deeper layer of confirmation. By aligning momentum signals with volume-weighted price movements, traders can better determine whether institutional activity supports the signals they’re seeing.
AI Backtesting for Strategy Optimization
LuxAlgo’s AI Backtesting Assistant helps refine Ultimate Oscillator strategies.
This web-based platform enables traders to test strategies across thousands of scenarios without manual effort. Whether you’re working with S&P 500 stocks, NASDAQ growth companies, or commodity futures, the platform analyzes extensive historical data to identify which settings work best for specific assets.
The AI explores alternative period settings beyond the standard 7, 14, and 28. For instance, shorter periods may perform better with volatile small-cap stocks, while longer periods might be more effective for stable, dividend-paying equities.
Another advantage is rapid evaluation—you can iterate on settings as market conditions shift. During volatile times, like earnings seasons or Federal Reserve policy updates, the AI can quickly suggest parameter adjustments.
The platform also supports cross-timeframe analysis, helping traders align short-term signals with longer-term trends. Day traders can fine-tune intraday strategies, while swing traders can use insights to optimize entries and exits.
Integration with TradingView
LuxAlgo’s indicators integrate seamlessly with TradingView, bringing enhanced analysis directly into a familiar charting environment.
This integration eliminates the hassle of switching between platforms or manually transferring data. Traders can view Ultimate Oscillator signals alongside added confirmations, such as divergences or volume-based patterns, directly within their TradingView charts.
Custom alerts notify traders when specific conditions are met, like momentum shifts or multi-timeframe confirmations. These alerts can also be connected to automated trading systems, allowing trades to be executed based on combined signals from the Ultimate Oscillator and LuxAlgo’s enhancements.
The integration supports portfolio-level analysis, enabling traders to monitor oscillator signals across multiple positions at once. This is especially helpful for managing risk and position sizing when trading across various U.S. market sectors, which can react differently to momentum signals.
Additionally, TradingView’s built-in backtesting makes it easy to validate Ultimate Oscillator strategies on the same charts used for live trading, ensuring a smoother transition and minimizing operational errors.
Conclusion
The Ultimate Oscillator has earned its place as a dependable momentum indicator, thanks to its multi-timeframe approach. By analyzing price movements across three distinct periods—commonly 7, 14, and 28—it delivers a broader perspective on market momentum compared to single-timeframe oscillators. This method not only minimizes false signals but also provides more consistent momentum readings, making it valuable in volatile markets, particularly in the U.S.
By filtering out short-term market noise, the Ultimate Oscillator highlights meaningful momentum shifts. It identifies potential reversals by signaling overbought or oversold conditions. Its real strength lies in spotting divergences between price action and oscillator readings—these often precede major market reversals, offering higher-probability setups.
LuxAlgo takes this further by providing TradingView tools that incorporate the Ultimate Oscillator into a sophisticated workflow. Features like the Oscillator Matrix automate divergence detection, combining momentum signals with money-flow context to save traders hours of manual analysis. Additionally, the AI Backtesting Assistant fine-tunes the oscillator’s settings, helping traders discover the best parameters for specific assets or market environments.
Key Takeaways
- Multi-timeframe analysis enhances reliability. By using three periods, the Ultimate Oscillator reduces the impact of short-term fluctuations, delivering more stable momentum readings than single-timeframe indicators.
- Overbought and oversold levels provide actionable insights. Readings above 70 can signal potential reversals or pullbacks, while readings below 30 may indicate buying opportunities. These signals are most effective when aligned with other technical indicators.
- Divergences highlight potential trend shifts. Bullish divergences (lower lows in price, higher lows in the oscillator) and bearish divergences (higher highs in price, lower highs in the oscillator) often precede meaningful market reversals.
- Context is critical. Always interpret signals in the context of the broader market trend. For example, an overbought reading in a strong uptrend might suggest a minor pullback rather than a full reversal.
- LuxAlgo tools simplify and enhance usage. With features like automatic divergence detection, AI-assisted parameter optimization, and seamless TradingView integration, LuxAlgo streamlines analysis while allowing traders to adapt to evolving market conditions.
The Ultimate Oscillator is most effective when traders understand its strengths and limitations, using it as part of a well-rounded analytical strategy.
FAQs
How Does the Ultimate Oscillator Help Reduce False Signals Compared to Single-Timeframe Indicators?
The Ultimate Oscillator stands out by blending momentum data from three different timeframes. This multi-timeframe strategy helps cut through short-term market noise and erratic price swings, which often lead to unreliable signals when relying on single-timeframe indicators.
By providing a more comprehensive and balanced picture of market momentum, the Ultimate Oscillator enables traders to spot trends with greater precision. It reduces the chances of being thrown off by fleeting price changes or misleading reversals.
What Are the Advantages of Using the Ultimate Oscillator for Trading Cryptocurrencies, Commodities, and Forex?
The Ultimate Oscillator offers valuable insights for traders navigating markets like cryptocurrencies, commodities, and forex. By blending momentum data from three different timeframes, it helps pinpoint overbought and oversold conditions more reliably, cutting down on false signals—a crucial advantage in fast-moving markets like crypto and forex.
Its ability to use multiple timeframes reduces market noise, providing a clearer picture of price trends. This makes it a handy indicator for analyzing a wide range of assets. Traders can adjust their strategies based on the oscillator’s insights, tailoring their approach to match various market environments and conditions more effectively.
How Can Traders Use Divergence Signals from the Ultimate Oscillator to Identify Potential Market Reversals?
Traders can spot potential market reversals using divergence signals from the Ultimate Oscillator by watching for discrepancies between its movement and price action. A bullish divergence shows up when the price hits a lower low, but the oscillator doesn’t follow suit. This suggests that downward momentum is losing steam and an upward reversal might be on the horizon. Conversely, a bearish divergence happens when the price reaches a higher high, but the oscillator fails to match it, hinting at a possible downward reversal.
When these divergence patterns are paired with overbought or oversold conditions on the oscillator, they can provide stronger clues about upcoming market shifts. For the best results, traders should use this strategy in combination with other technical analysis tools to confirm signals and make more informed decisions.
References
LuxAlgo Resources
- LuxAlgo — Official Site
- AI Backtesting Assistant
- AI Backtesting Assistant — Docs
- Adaptive Momentum Oscillator
- Multi-Timeframe Market Formation
- Price Action Concepts
- Oscillator Matrix — Reversal Signals
- Range Detector (True Range Context)
- Battle Signals
- Reversal Signals (Library)
- BROZ Toolkit
- Triangular Momentum Oscillator — Real-Time Divergences
- Oscillator Matrix (Library)
- New AI Backtesting Features for Smarter Trading
- The Best Indicator Settings & Timeframes
- How Complex Adaptive Systems Shape Modern Trading
- Reversal Spotting Made Easy


