
Explore how to analyze options market signals with institutional-level data for better trading decisions and effective risk management.
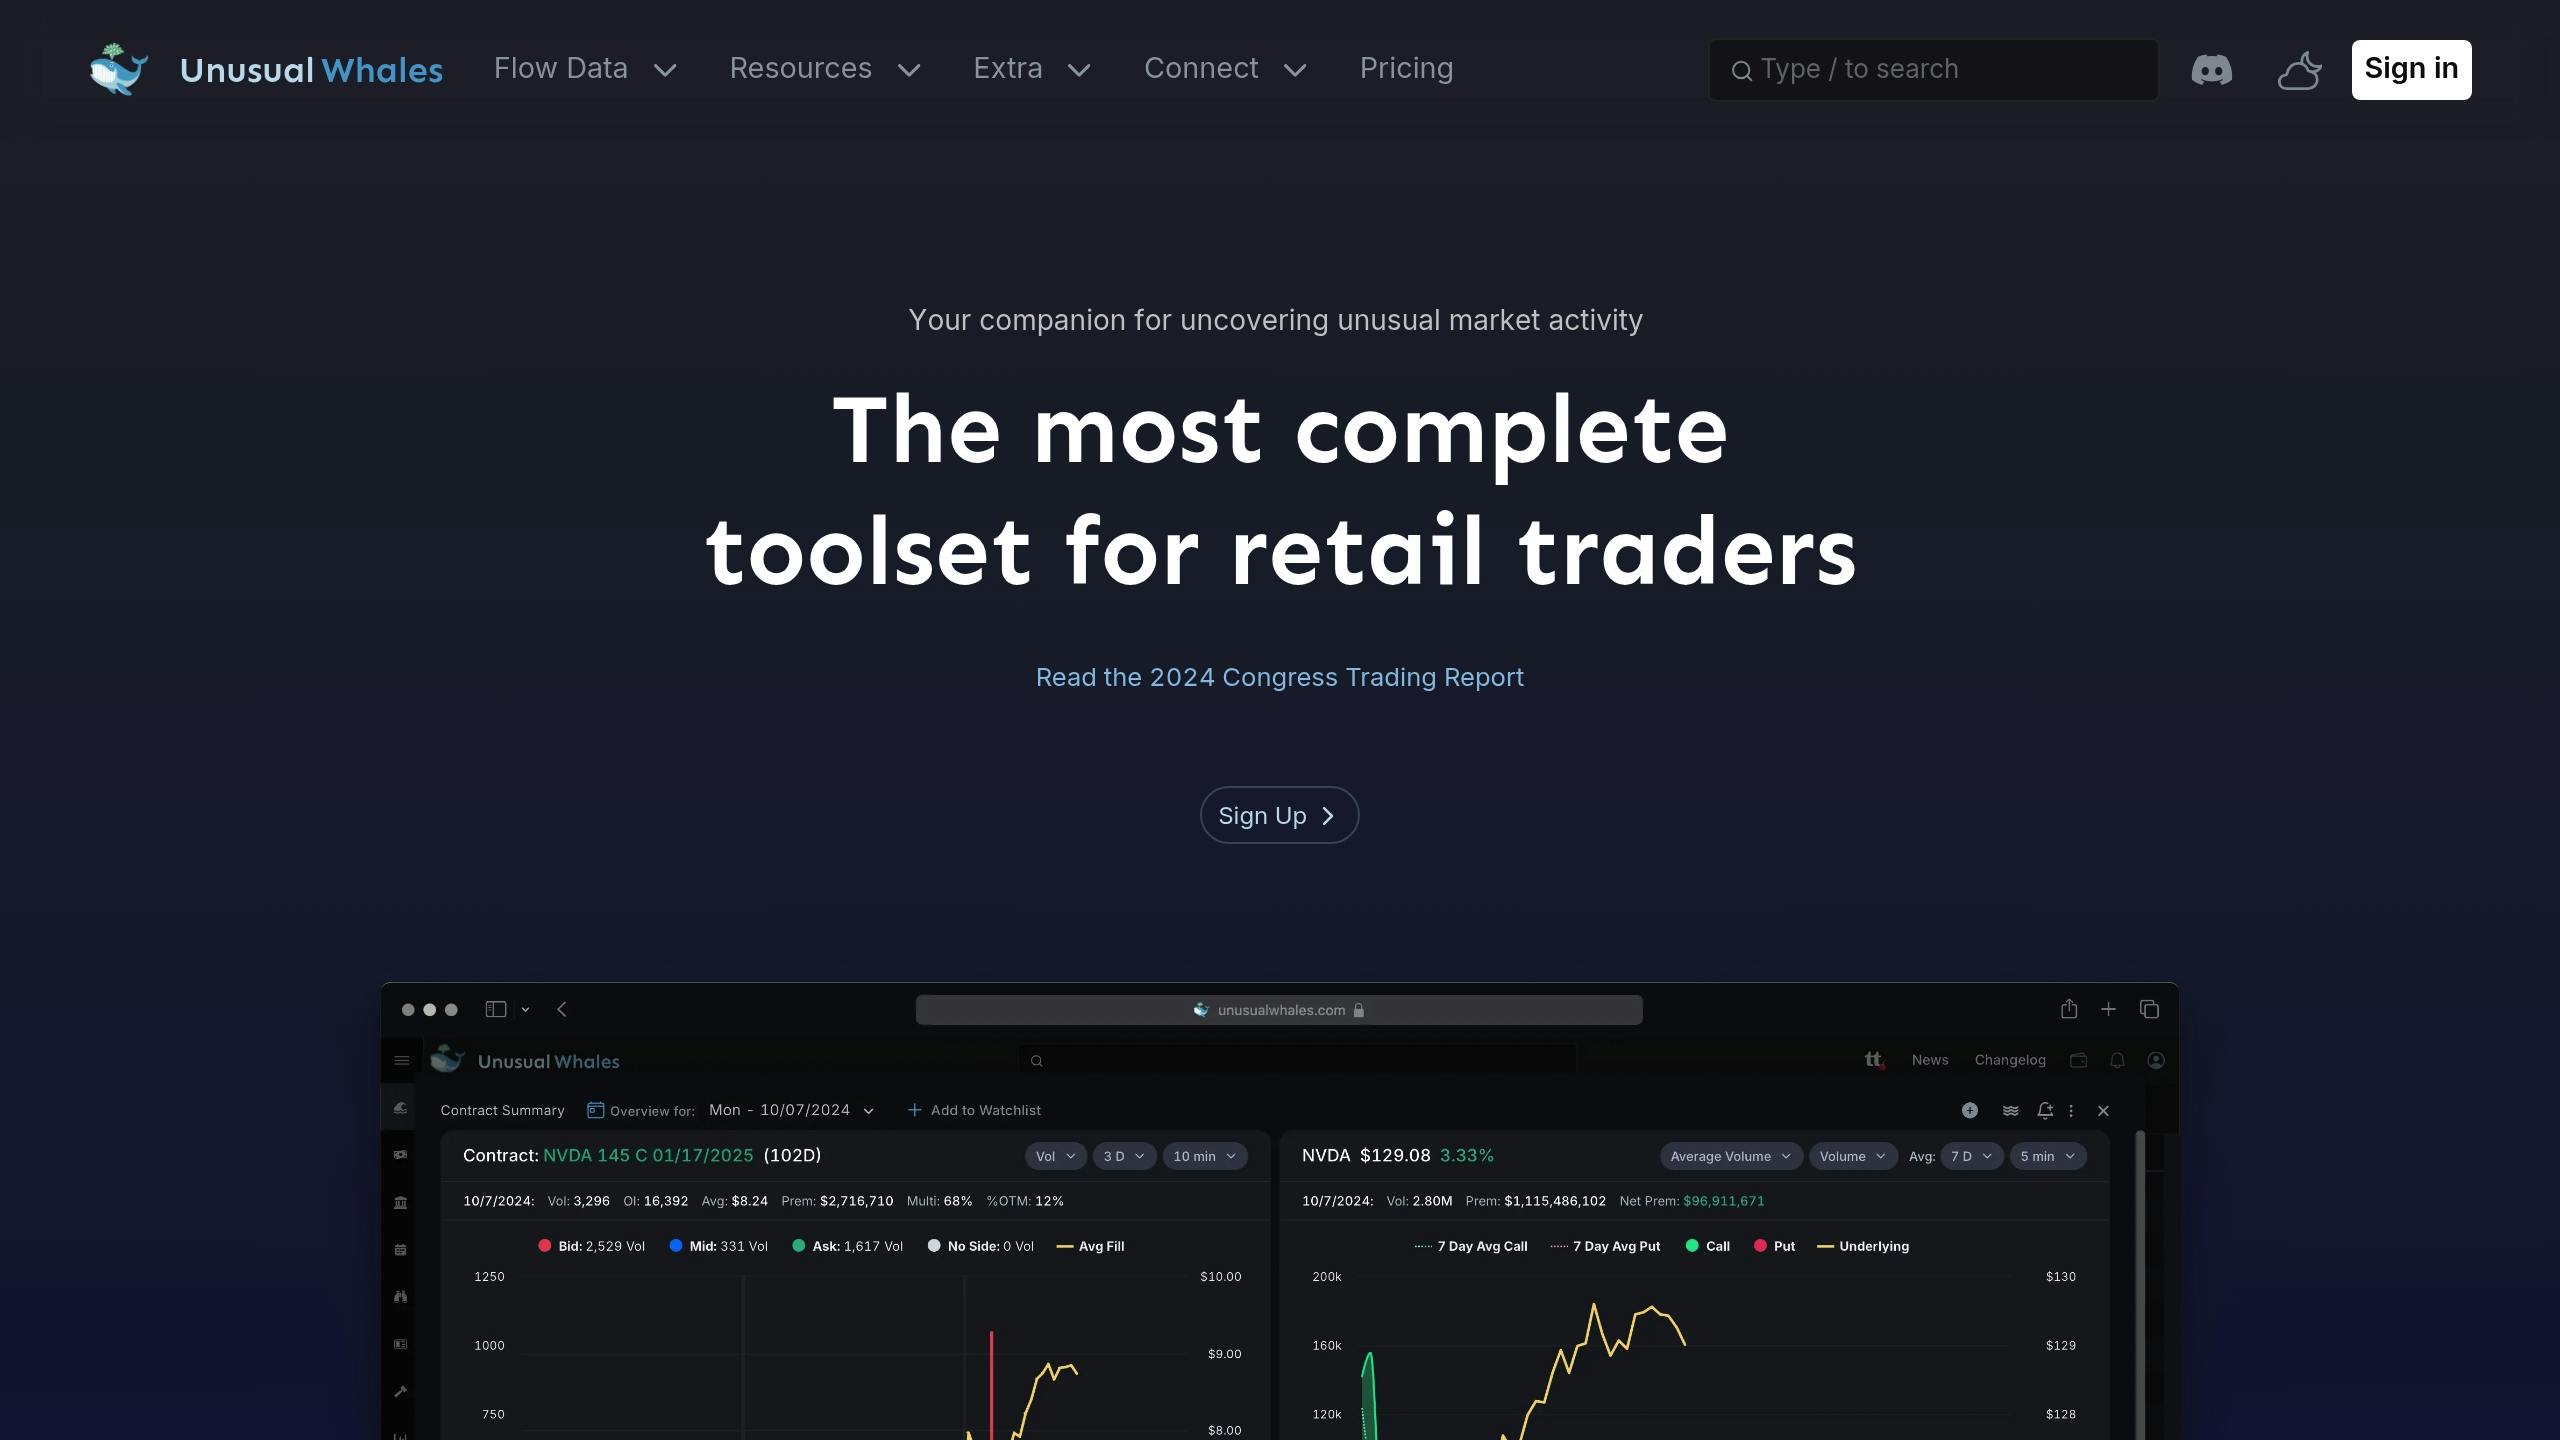
Unusual Whales is a platform designed to help traders analyze large-scale trading activity in the options market. By tracking institutional trades, dark pool data, and other key metrics, it provides insights that bridge the gap between retail and institutional investors. Here's what you need to know:
- Key Features: Real-time alerts, dark pool data, customizable screeners, and sentiment indicators.
- Core Metrics: Options flow, volume/open interest, implied volatility, and daily premium traded.
- Signal Analysis: Combine multi-indicator analysis, historical patterns, and dark pool activity for better trading decisions.
- Risk Management: Use price alerts, stop-loss strategies, and position sizing to manage risks effectively.
- Pricing: Subscriptions start at $35/month, with additional tools available for advanced users.
Unusual Whales empowers traders with institutional-level data, making it easier to spot opportunities and refine strategies. Ready to get started? Dive into the details below.
How To Follow Large Option Order Flow | Unusual Whales Options Flow Tutorial
Reading Unusual Whales Alerts
This section dives into how to interpret Unusual Whales alerts effectively. Below, you'll find a breakdown of the main components and methods to help you make sense of the data.
Alert Components
Each alert includes detailed information to guide trading decisions. Here's a quick look at the key elements:
| Component | Description | Trading Significance |
|---|---|---|
| Option Contract | Ticker and strike price (green for calls, red for puts) | Indicates direction and potential price targets |
| Volume/OI | Daily volume and Open Interest | Reflects the level of trading activity |
| Underlying Price | The stock's current price at alert time | Helps assess the relationship to the strike price |
| IV (Implied Volatility) | Contract's implied volatility | Suggests anticipated price movement |
| Daily $ Volume | Total premium traded on the contract | Highlights possible institutional involvement |
| % Difference | Gap between strike price and underlying price | Shows how aggressive the trade might be |
Signal Analysis Metrics
Alerts are most reliable between 10 AM and 4 PM EST, as this period avoids the volatility of market open. The platform deliberately skips issuing alerts during the first 30 minutes of trading (9:30–10:00 AM EST) to reduce noise from early market fluctuations.
To get the full picture, consider these factors:
- Historical volume trends
- Dark pool activity
- Option chain distribution
- Bid/ask pressure
By combining these metrics, you can better understand the market dynamics behind each alert.
Market Direction Signals
In addition to the core metrics, market direction signals offer a broader view of sentiment. The Net Flow feature tracks the balance between call and put activity throughout the trading day, helping you gauge overall market trends.
Key points to keep in mind:
- Alerts are not direct buy or sell recommendations.
- A single alert can be triggered by multiple transactions.
- Options trades may form part of more complex strategies.
To refine your analysis, look at bid/ask spreads and fill prices to infer trade direction. Always view alerts within the larger market context and consider the possibility of multi-leg strategies.
Signal Analysis Methods
Multi-Indicator Analysis
Using multiple indicators together can help validate trading opportunities. The Unusual Whales platform offers several tools that, when combined, create a robust framework for analysis.
When examining unusual options activity, pay attention to these key indicators:
| Indicator Type | What to Watch | Why It Matters |
|---|---|---|
| Options Flow | Block orders, sweeps | Highlights institutional activity |
| Volume Patterns | Trade size, frequency | Shows market interest and activity |
| Price Action | Strike price relationships | Indicates directional trends |
| Dark Pool Activity | Off-exchange volume | Confirms institutional involvement |
To enhance your analysis, cross-check these indicators with technical analysis tools. The platform's options flow tracker allows you to filter by trade type, sector, expiration date, and volume. This helps identify patterns that align with your trading strategies.
Historical Pattern Analysis
Once you've reviewed multiple indicators, take a step back and analyze historical patterns to refine your signal interpretation. By systematically studying past data, you can identify consistent signals. Look for chart patterns like head and shoulders or triangles to confirm your findings. This approach complements the real-time data provided by Unusual Whales alerts.
Dark Pool Trading Signals
Dark pool activity adds another layer of insight into institutional trading behavior. For some heavily traded stocks, as much as 30–40% of the total volume occurs in dark pools. Here’s how dark pool signals differ from standard market signals:
| Dark Pool Signal | Standard Market Signal |
|---|---|
| Hidden pre-trade orders | Visible order book |
| Reporting delay | Real-time pricing |
| Focus on block trades | Varied trade sizes |
| Driven by institutions | Includes all traders |
To interpret dark pool signals effectively, focus on trade size, timing patterns, and price clusters. These elements can help confirm whether institutions are making significant moves.
Trading with Unusual Whales Signals
This section breaks down how to turn signals into actionable trading strategies.
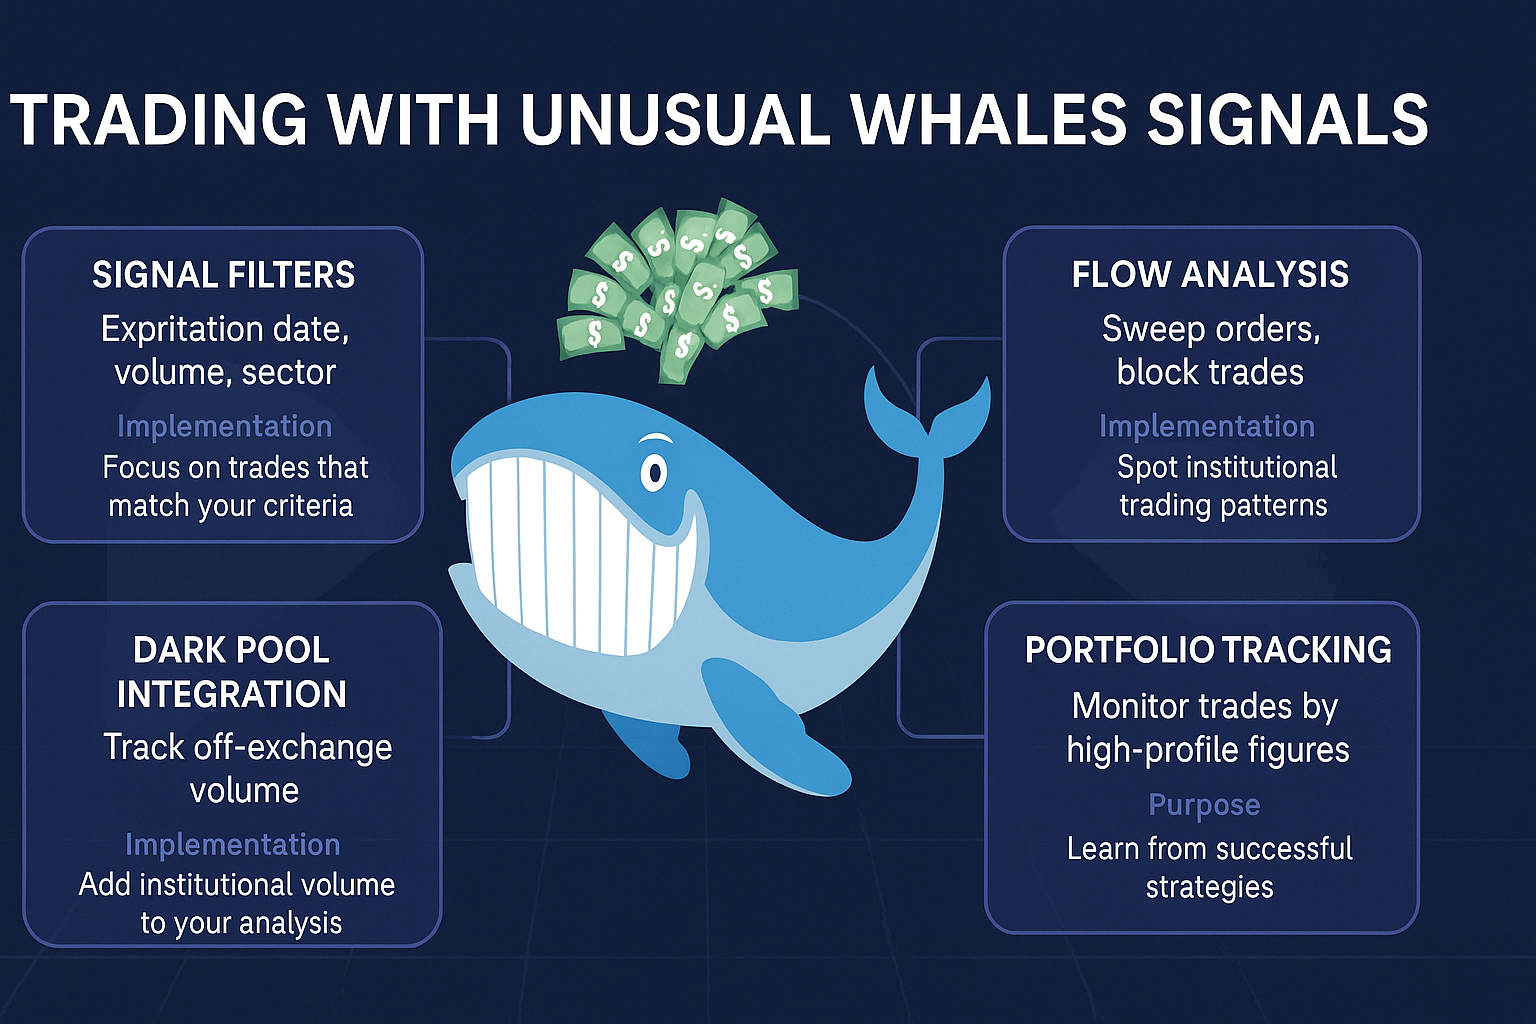
Building a Trading System
To create a trading system, combine options flow data with dark pool insights. Unusual Whales provides tools that help traders focus their strategies using several key components:
| Component | Implementation | Purpose |
|---|---|---|
| Signal Filters | Expiration date, volume, sector | Focus on trades that match your criteria |
| Flow Analysis | Sweep orders, block trades | Spot institutional trading patterns |
| Dark Pool Integration | Track off-exchange volume | Add institutional volume to your analysis |
| Portfolio Tracking | Monitor trades by high-profile figures | Learn from successful strategies |
Once your system is in place, make sure to include strong risk controls to handle market fluctuations.
Risk Control Methods
Managing risk is essential. Use these strategies to protect your portfolio:
| Risk Control Element | Strategy | Implementation |
|---|---|---|
| Price Alerts | Use alerts instead of hard stops | Prevent stop-loss hunting |
| Stop-Loss Placement | Set stops away from psychological levels | Minimize chances of manipulation |
| Position Sizing | Adjust size based on order book data | Align risk with market conditions |
| Volume Analysis | Watch dark pool activity | Confirm trade direction before executing |
Trade Examples
By applying these systems and risk management techniques, traders have achieved notable results. Here are some examples of successful trades using Unusual Whales signals:
- February 7, 2025:
- Whale 0xb47/0x25e: Earned a $7.75M profit (+41.7%) on a WBTC trade held for six months.
- Whale 0x0c9: Made $978K (+7.63%) in just four days.
Political trades have also shown impressive gains:
- Representative Josh Gottheimer: Saw a 100% increase in Fair Isaac Corporation ($FICO) shares.
- Senator Markwayne Mullin: Turned a $30K investment in Badger Meters ($BMI) into a 55% gain.
- Representative Dan Crenshaw: Achieved a 56% return on a $15K position in Wynn Resorts ($WYNN).
Signal Analysis Software
To analyze signals effectively, having the right software components is essential. Unusual Whales stands out as a dedicated platform for options analytics, offering features that go beyond what traditional trading platforms provide.
Unusual Whales Platform Guide
Unusual Whales focuses on options flow analysis with a variety of elements designed to assist traders. Here's a breakdown of its core features:
| Feature Category | Components | Purpose |
|---|---|---|
| Flow Analysis | 0DTE Flow, Net Flow, Hottest Contracts | Monitor real-time options activity and understand market sentiment |
| Stock Tools | Market Overview, Screener, Sector/ETF Flow | Spot broader trends and uncover opportunities |
| Advanced Analytics | Gamma Exposure, Volatility Metrics | Evaluate market dynamics and manage risk |
| Portfolio Tracking | Fund Manager, Political Trading Data | Keep tabs on fund managers and political trading activity |
The platform is priced at $48 per month or $448 annually. The annual plan includes perks like downloadable data and API access. For those looking to expand their toolkit, the portfolios section is available for an additional $10 per month.
To get the most out of Unusual Whales, consider pairing it with other trading components.
Additional Analysis Tools
While Unusual Whales provides in-depth options data, combining it with LuxAlgo can add more depth to your analysis:
- Price Action Concepts (PAC): An exclusive toolkit that automates price action analysis, including support & resistance, trend lines, and patterns, suitable for traders of all levels.
- Signals & Overlays (S&O): A comprehensive toolkit offering various signal modes, indicator overlays, and advanced alerts to enhance trading decisions for both beginners and experienced traders.
- Oscillator Matrix (OSC): A toolkit that includes a money flow indicator aimed at detecting trends based on market participants' activity, providing longer-term indications to support shorter-term signals.
Tool Integration Guide
Bringing multiple platforms together can simplify your trading process. Here's how you can combine elements effectively:
| Integration Level | Primary Component | Supporting Component | Implementation |
|---|---|---|---|
| Basic Analysis | Unusual Whales Options Flow | TradingView Charts | Use TradingView to cross-check data visually |
| Advanced Signals | Unusual Whales Dark Pool | LuxAlgo Signals & Overlays | Confirm institutional activity with LuxAlgo layers |
| Automation | Unusual Whales API | Custom Applications | Build custom alerts and integrations |
| Community | Discord Integration | Platform Alerts | Get real-time updates and interact with other traders |
Unusual Whales' API access allows you to create custom applications tailored to your trading needs. The platform's Discord integration adds value by delivering instant alerts and fostering community discussions. Additionally, ThinkorSwim is a great companion platform, offering advanced charting and paper trading features that complement Unusual Whales' specialized options data.
Conclusion
Main Points Review
Unusual Whales offers real-time data that was once exclusive to large institutions. By combining options activity alerts, dark pool data, and customizable screeners, it helps traders make informed decisions.
Here’s a breakdown of the key analysis layers and how LuxAlgo components can enhance your workflow:
| Analysis Layer | Primary Components | Purpose |
|---|---|---|
| Signal Validation | Multi-Indicator Analysis, Volume Spikes | Confirms whale activity using multiple data points |
| Risk Management | Risk controls | Protects your capital while tracking market trends |
| Market Context | News Integration, Sentiment Analysis | Adds a broader perspective to whale movements |
| Technical Confirmation | Price Action, Volume Analysis | Verifies signals using traditional technical methods |
These approaches enhance the platform's real-time insights, helping you turn data into actionable trading steps.
Getting Started Steps
Ready to dive in? Follow these steps to get started:
-
Platform Setup and Learning
Begin with the $48 monthly subscription. Familiarize yourself with the options flow elements and set up personalized alerts. -
Signal Analysis Implementation
Focus on active markets where whale signals are more consistent. Use technical analysis and market sentiment to confirm your findings. -
Risk Management and Community
Use the platform's risk controls to safeguard your trades. Join the Discord community to exchange ideas and refine your strategy.


