
Explore the Vortex Indicator, a tool for identifying trend direction and strength in trading, and learn how to enhance its signals with advanced tools.
The Vortex Indicator (VI) is a technical analysis tool designed to identify trend direction and strength. It uses two oscillating lines - VI+ and VI− - to signal potential uptrends and downtrends. When VI+ crosses above VI−, it indicates upward momentum, while VI− crossing above VI+ suggests a downtrend. Developed by Etienne Botes and Douglas Siepman in 2010, the indicator draws inspiration from natural vortex patterns and J. Welles Wilder’s directional movement principles.
Key Takeaways:
- How It Works: VI+ measures upward price movement (current high vs. previous low), while VI− tracks downward movement (current low vs. previous high). Both are normalized using the True Range to account for volatility.
- Signals: Clear crossovers between VI+ and VI− provide straightforward buy or sell signals. A wider gap between the lines indicates stronger trends.
- Market Use: Effective for spotting new trends or trend continuations across stocks, forex, and crypto. However, it may produce false signals in sideways markets.
- Settings: Default 14-period works for most cases, but shorter periods offer faster signals (risking noise), and longer periods smooth trends for broader market shifts.
Pairing the Vortex Indicator with tools like LuxAlgo’s PAC Toolkit, OSC Toolkit, and S&O Toolkit on TradingView can improve signal confirmation and strategy precision. These integrations help traders refine their approach, reduce false positives, and better align with market conditions.
Vortex Indicator Explained: Strategy, Settings & How to Trade With It
How the Vortex Indicator Works
The Vortex Indicator offers a unique perspective on price dynamics by focusing on sequential price movements rather than just closing prices. Its design helps traders identify natural market flows and potential trends with precision.
Vortex Indicator Mechanics
At its core, the Vortex Indicator uses the highs and lows from the last two periods to calculate two key measurements:
- Positive trend movement (VI+): This measures the distance from the current high to the previous low. It highlights upward momentum by showing how far the current high surpasses the prior low, signaling strong upward price movement.
- Negative trend movement (VI-): This is the distance between the current low and the previous high. It reflects downward momentum, with larger distances indicating stronger downward pressure.
"The vortex indicator relies heavily on the earlier work of J. Welles Wilder, the creator of several important technical indicators. The vortex indicator builds on a signaling mechanism for new and accelerating uptrends and downtrends." – Investopedia
The calculations incorporate 14-period readings, adjusted using J. Welles Wilder's True Range. This adjustment accounts for market volatility, ensuring the indicator remains effective in various trading conditions. These computed values form the foundation of the VI+ and VI- lines.
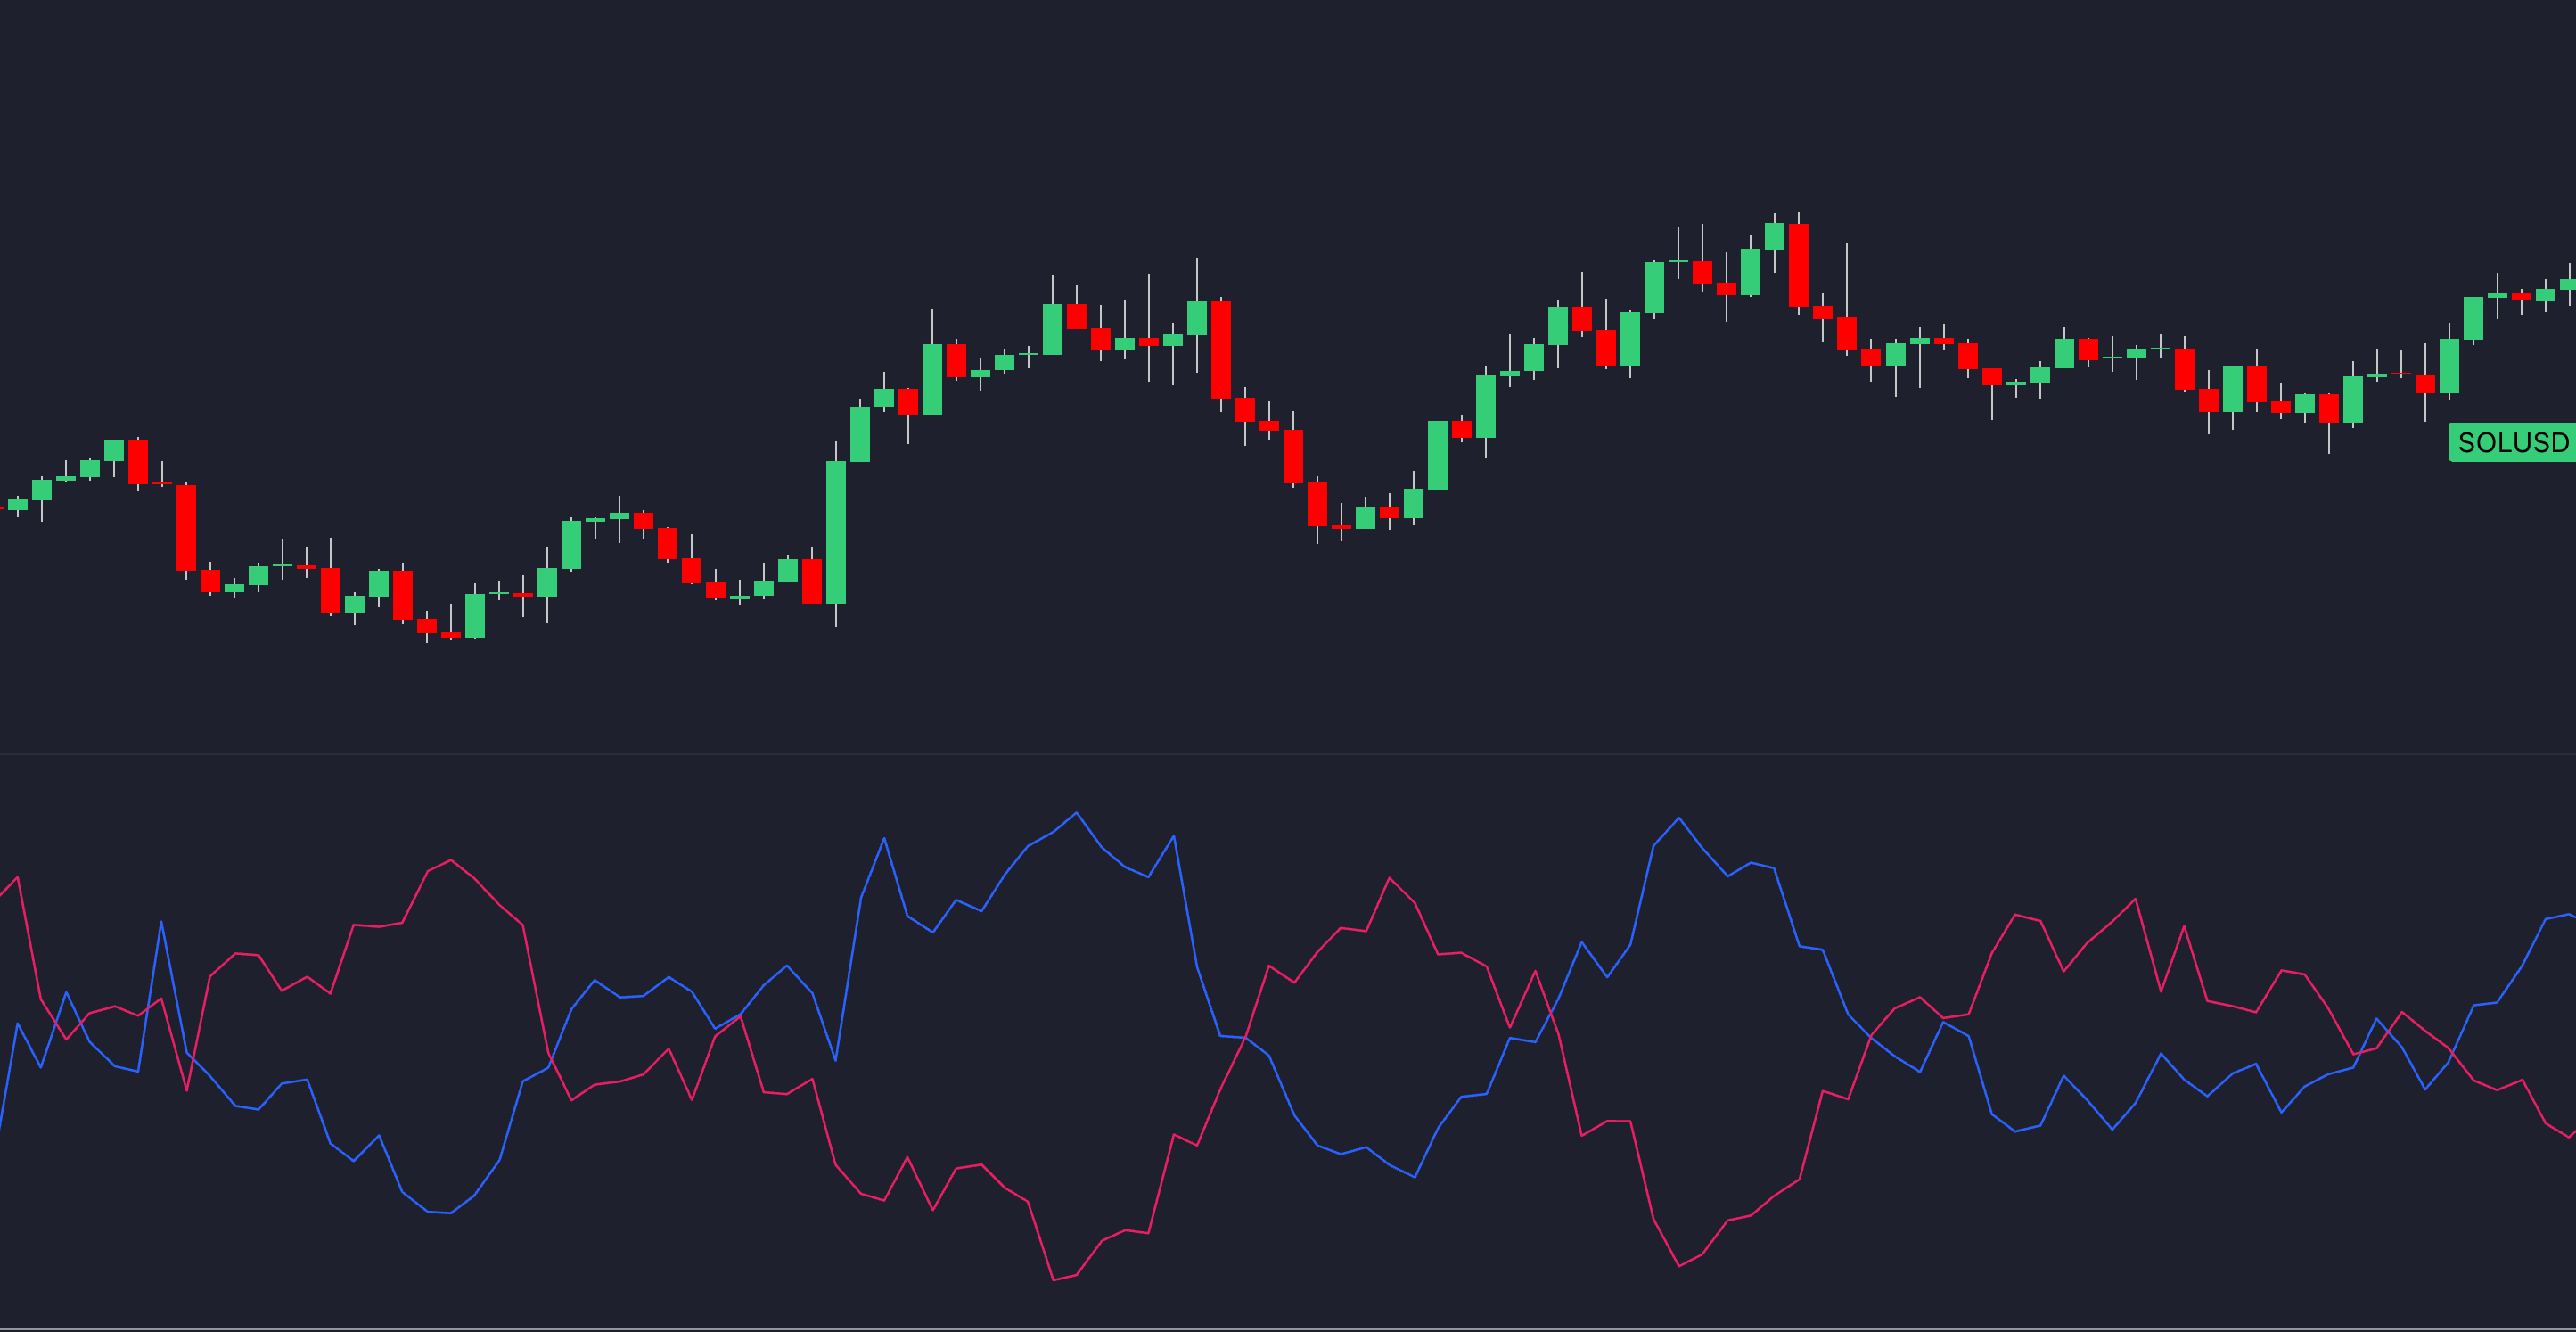
VI+ and VI- Lines Explained
The Vortex Indicator consists of two oscillating lines: VI+ for positive movement and VI- for negative movement. Here's how they work:
- When the VI+ line crosses above the VI- line, it suggests a potential bullish trend.
- Conversely, if the VI- line crosses above the VI+ line, it signals a possible bearish trend.
The distance between these lines also reveals the trend's strength. A wider gap indicates a strong trend, while a narrowing gap might suggest consolidation or a potential reversal. Importantly, the Vortex Indicator always leans toward either a bullish or bearish bias, ensuring traders receive clear directional insights.
Shared Principles with ADX
While the Vortex Indicator has its unique approach, it shares some mathematical foundations with the Average Directional Index (ADX). Both indicators draw on J. Welles Wilder's concepts, particularly the +DI and –DI components, but they serve different purposes:
- The Vortex Indicator distinctly separates positive and negative momentum, offering a clear view of trend direction.
- The ADX, on the other hand, focuses on trend strength without specifying direction (learn how ADX is calculated).
Another key difference is how they signal trends. The ADX can produce neutral readings, signaling caution, while the Vortex Indicator always points to a trend direction. By analyzing real-time high/low price patterns instead of relying on smoothed averages, the Vortex Indicator often provides quicker signals for detecting emerging trends.
Vortex Indicator Calculation Guide
The Vortex Indicator turns raw price data into actionable trend signals. Its calculation involves three steps that work together to create the VI+ and VI- lines you see on trading charts. Let’s break down each step to show how these values are derived.
Step 1: Measure Positive and Negative Movements
This step identifies the direction of price trends by quantifying how prices move in relation to their previous levels. It calculates two key values: Positive Movement (VM+) and Negative Movement (VM-).
- Positive Movement (VM+): The difference between the current high and the previous low. This measures how much the price has risen compared to the last session.
- Negative Movement (VM-): The difference between the current low and the previous high. This shows how much the price has dropped relative to the previous session.
Once these are calculated for each period, sum them over the selected timeframe (often 14 periods) to get the totals, labeled as +VM14 and -VM14.
| Movement Type | Formula |
|---|---|
| Positive Movement (VM+) | Current High - Previous Low (absolute value) |
| Negative Movement (VM-) | Current Low - Previous High (absolute value) |
Step 2: Determine the True Range (TR)
The True Range accounts for market volatility, ensuring the indicator adapts to price gaps or unusual movements. It’s calculated by identifying the largest value among three options:
- The difference between the current high and current low.
- The absolute difference between the current high and the previous closing price.
- The absolute difference between the current low and the previous closing price.
This method ensures that any price gaps or extreme movements are factored in. After calculating the True Range for each period, sum these values over the chosen timeframe (e.g., 14 days) to get the Sum of True Range (SUM TRn). This total is crucial for normalizing the indicator values.
Step 3: Calculate VI+ and VI- Values
Now, it’s time to derive the final VI+ and VI- lines. These are calculated by dividing the summed positive and negative movements by the Sum of True Range:
- VI+: Divide the positive movement sum (+VM14) by the True Range sum (SUM TR14).
- VI-: Divide the negative movement sum (-VM14) by the True Range sum (SUM TR14).
This step adjusts the trend movements to account for market volatility, giving you the final VI+ and VI- values you use to interpret trends on your trading platform.
Trading with the Vortex Indicator
Building on the mechanics and calculations we discussed earlier, the Vortex Indicator (VI) provides a way to turn its VI+ and VI- values into actionable trading signals. By understanding these signals and tweaking the indicator's settings, traders can make better decisions across varying market conditions.
Reading Crossover Signals
A bullish crossover happens when VI+ crosses above VI-, signaling that upward momentum is building. This is typically seen as a buy signal. The signal becomes stronger when the lines separate clearly after the crossover, indicating a decisive shift in market direction.
On the flip side, a bearish crossover occurs when VI- moves above VI+, pointing to increasing downward momentum. This serves as a sell signal. Similar to the bullish crossover, the strength of the signal is confirmed when the lines maintain a clear separation.
The distance between the lines after a crossover is also important. A widening gap suggests a strong trend, while a narrowing gap may indicate consolidation or even a potential reversal. However, in choppy or sideways markets, frequent crossovers can generate false signals. To minimize these, many traders use additional confirmation tools, such as higher-timeframe highs/lows breakouts, Signals & Overlays, and price action before acting on Vortex signals.
Adjusting Settings for Different Markets
The default 14-period setting is widely used and works well for most daily trading scenarios. It strikes a balance between detecting trend changes and filtering out minor price noise, as it covers roughly two weeks of trading data.
For traders who need quicker signals, such as day traders, shorter periods (7-10) increase the indicator's sensitivity. However, this comes with the risk of more false signals, especially in ranging markets. On the other hand, longer periods (21-30) smooth out the indicator's movements, making it more suitable for swing or position traders who aim to capture major trend shifts.
Adjusting the settings based on the market type can also enhance the indicator's performance. For example:
- In highly volatile markets like cryptocurrencies, using longer periods can help filter out excessive noise and provide more reliable signals.
- In more stable markets, such as large-cap stocks, shorter periods may do a better job of capturing trend changes.
By tailoring the settings to the market you're trading, you can better harness the strengths of the Vortex Indicator. If you use LuxAlgo’s PAC Toolkit, its Order Blocks and structure settings can help define context for VI crossovers (see Order Blocks).
Pros and Cons of the Vortex Indicator
Like any tool, the Vortex Indicator has its strengths and weaknesses. Understanding these can help you use it more effectively.
| Advantages | Disadvantages |
|---|---|
| Easy-to-read signals through line crossovers | Prone to false signals in sideways markets |
| Flexible timeframes for different trading styles | Lagging signals that appear after trends have started |
| Accounts for volatility using True Range in its calculation | Less reliable in low-volatility markets with weak trends |
| Simple to use even for those with limited technical analysis experience | Needs additional confirmation from other tools for best results |
| Versatile across asset classes like stocks, forex, commodities, and crypto | Struggles in market transitions between trending and ranging phases |
The Vortex Indicator shines in trending markets, where its crossovers align with sustained price movements. In these conditions, its signals tend to be more accurate and profitable.
However, it’s less effective in consolidating markets, where prices move sideways within a tight range. In such scenarios, VI+ and VI- often cross back and forth without establishing clear trends, leading to false signals and potential losses. Recognizing when the market environment suits the indicator is key to using it successfully. In these periods, monitoring trading volume dynamics can help filter noise.
Using LuxAlgo Tools with the Vortex Indicator
The Vortex Indicator is a powerful approach for identifying trend direction, but when paired with LuxAlgo’s features, its potential grows significantly. LuxAlgo provides TradingView tools that enhance VI signals and offer deeper confirmations, making trading strategies more precise and actionable.
LuxAlgo Toolkits Integration
LuxAlgo’s ecosystem complements the Vortex Indicator by adding structural and momentum-based confirmations. For instance:
- PAC Toolkit: Provides structural context for VI signals. If VI suggests a bullish trend, the PAC toolkit’s auto-pattern detection and volumetric order blocks can highlight key support levels or breakout patterns.
- OSC Toolkit: Focuses on momentum confirmation and divergence detection (Oscillator Matrix and its reversal signals). Its money flow analysis helps determine whether volume aligns with VI crossovers.
- Signals & Overlays (S&O) Toolkit: Adds algorithmic confirmations to VI crossovers—use confirmations from S&O before acting.
By layering these tools, traders can refine the Vortex Indicator’s output, turning raw signals into actionable insights.
Backtesting with LuxAlgo’s AI Assistant
LuxAlgo’s AI Backtesting Assistant simplifies evaluating VI-based strategies. Instead of manual parameter trials, the platform automates tests across assets and timeframes. For a deeper walkthrough, see our complete breakdown.
Traders on the Ultimate plan get ongoing scans and backtests that reflect evolving market conditions, helping you adapt strategy parameters as regimes change.
Combining Multiple Indicators
The strength of LuxAlgo lies in integrating multiple tools into coherent workflows. For example, you might use VI for primary signals, PAC for structural confirmation, and OSC for momentum validation. Together, these create a balanced approach that leverages the strengths of each component.
LuxAlgo’s Custom Alert Creator goes further by enabling alerts for stacked conditions—for instance, a bullish VI crossover aligned with PAC support and positive money flow from OSC.
With regular updates and ongoing support, these tools remain effective and adaptable as markets evolve.
Key Takeaways
Here’s a concise look at the main points about the Vortex Indicator and how it works alongside LuxAlgo’s tools.
The Vortex Indicator is a dependable option for analyzing trends. It shares similarities with the ADX but takes a distinct approach to gauge market direction. By tracking VI+ and VI- crossovers, it helps traders assess trend strength and spot potential reversals.
Vortex Indicator Overview
The simplicity of the Vortex Indicator is one of its biggest strengths. It provides clear buy and sell signals based on VI+ and VI- crossovers, making it suitable for traders at any experience level. This straightforward design is especially helpful in volatile markets, where other indicators might offer mixed messages.
What sets it apart is its ability to reflect the natural flow of price movements. When VI+ or VI- takes the lead, it confirms the current momentum, offering clarity that can reduce the confusion often caused by more complex, multi-line indicators. However, it’s worth noting that the indicator can generate false signals in sideways markets, so traders should factor in broader market conditions and adjust position sizes accordingly.
LuxAlgo’s Contribution to Trading
LuxAlgo elevates the Vortex Indicator by embedding it within broader, feature-rich workflows. Tools like AI Backtesting and customizable alerts complement VI signals, helping traders confirm market trends and momentum more effectively.
The Custom Alert Creator is a standout capability. It allows traders to set personalized alerts so they catch critical VI signals without being glued to the screen. By tailoring alerts to trigger only when specific conditions are met, traders can focus on what matters most while avoiding unnecessary distractions.
Plans are designed to scale with you: Free plan ($0), Premium ($39.99/month), and Ultimate ($59.99/month with AI Backtesting access).
FAQs
What makes the Vortex Indicator different from the Average Directional Index (ADX) when analyzing trends?
The Vortex Indicator and the ADX (Average Directional Index) each offer unique insights into market trends, but they approach the analysis from different angles.
The Vortex Indicator is all about trend direction. It uses two oscillating lines - one for positive momentum and the other for negative momentum. This visual setup helps traders quickly determine whether the market is moving upward or downward.
In contrast, the ADX focuses on trend strength rather than direction. It gauges how strong or weak a trend is, with a key threshold at 25. Readings above 25 typically point to a strong trend, while values below 25 suggest a weaker trend or a sideways market. For more on ADX, see this guide.
When used together, these tools can provide traders with a fuller picture, combining insights into both the direction and intensity of market trends.
How can I effectively use the Vortex Indicator in sideways markets to reduce false signals?
In sideways markets, where prices tend to consolidate and volatility is low, the Vortex Indicator can sometimes produce misleading signals. To reduce the risk of acting on these false signals, it’s a good idea to pair it with other tools like moving averages or the Relative Strength Index (RSI). These additional indicators can help confirm trends before you make a move.
Also, keep an eye on trading volume and broader market conditions. These factors can act as filters, helping you identify and avoid unreliable signals during periods of consolidation. By combining the Vortex Indicator with these confirmation methods, you can enhance the reliability of your trend analysis and make more confident trading decisions in ranging markets.
How can LuxAlgo’s tools improve the Vortex Indicator’s performance in volatile markets?
LuxAlgo’s tools take the Vortex Indicator further by incorporating features that adapt to volatility and tools for confirming trends. These enhancements are designed to help traders cut through false signals and focus on meaningful trend shifts.
By minimizing market noise and sharpening signal precision, LuxAlgo’s toolkits simplify how you identify dependable trends. This gives traders the clarity they need to make smarter, more confident decisions, even in unpredictable market environments.
References
LuxAlgo Resources
- LuxAlgo Indicator Library
- AI Backtesting Assistant
- Introducing LuxAlgo’s AI Backtesting Assistant
- Signals & Overlays™
- Price Action Concepts (Intro)
- Oscillator Matrix (Intro)
- Volumetric Order Blocks (PAC)
- Reversal Signals (OSC)
- Custom Alert Creator: Templates
- Previous Highs & Lows
- Money Flow Profile
- Oscillator Matrix™ (Library)
- Battle Signals
- Trendlines Oscillator
- Breakout Detector (Prev. MTF High/Low)


