

Learn to identify and trade wedge patterns, their signals, and how to effectively manage risks for better trading outcomes.
Wedge patterns are powerful tools in trading that signal potential market reversals or continuations. They come in two main types:
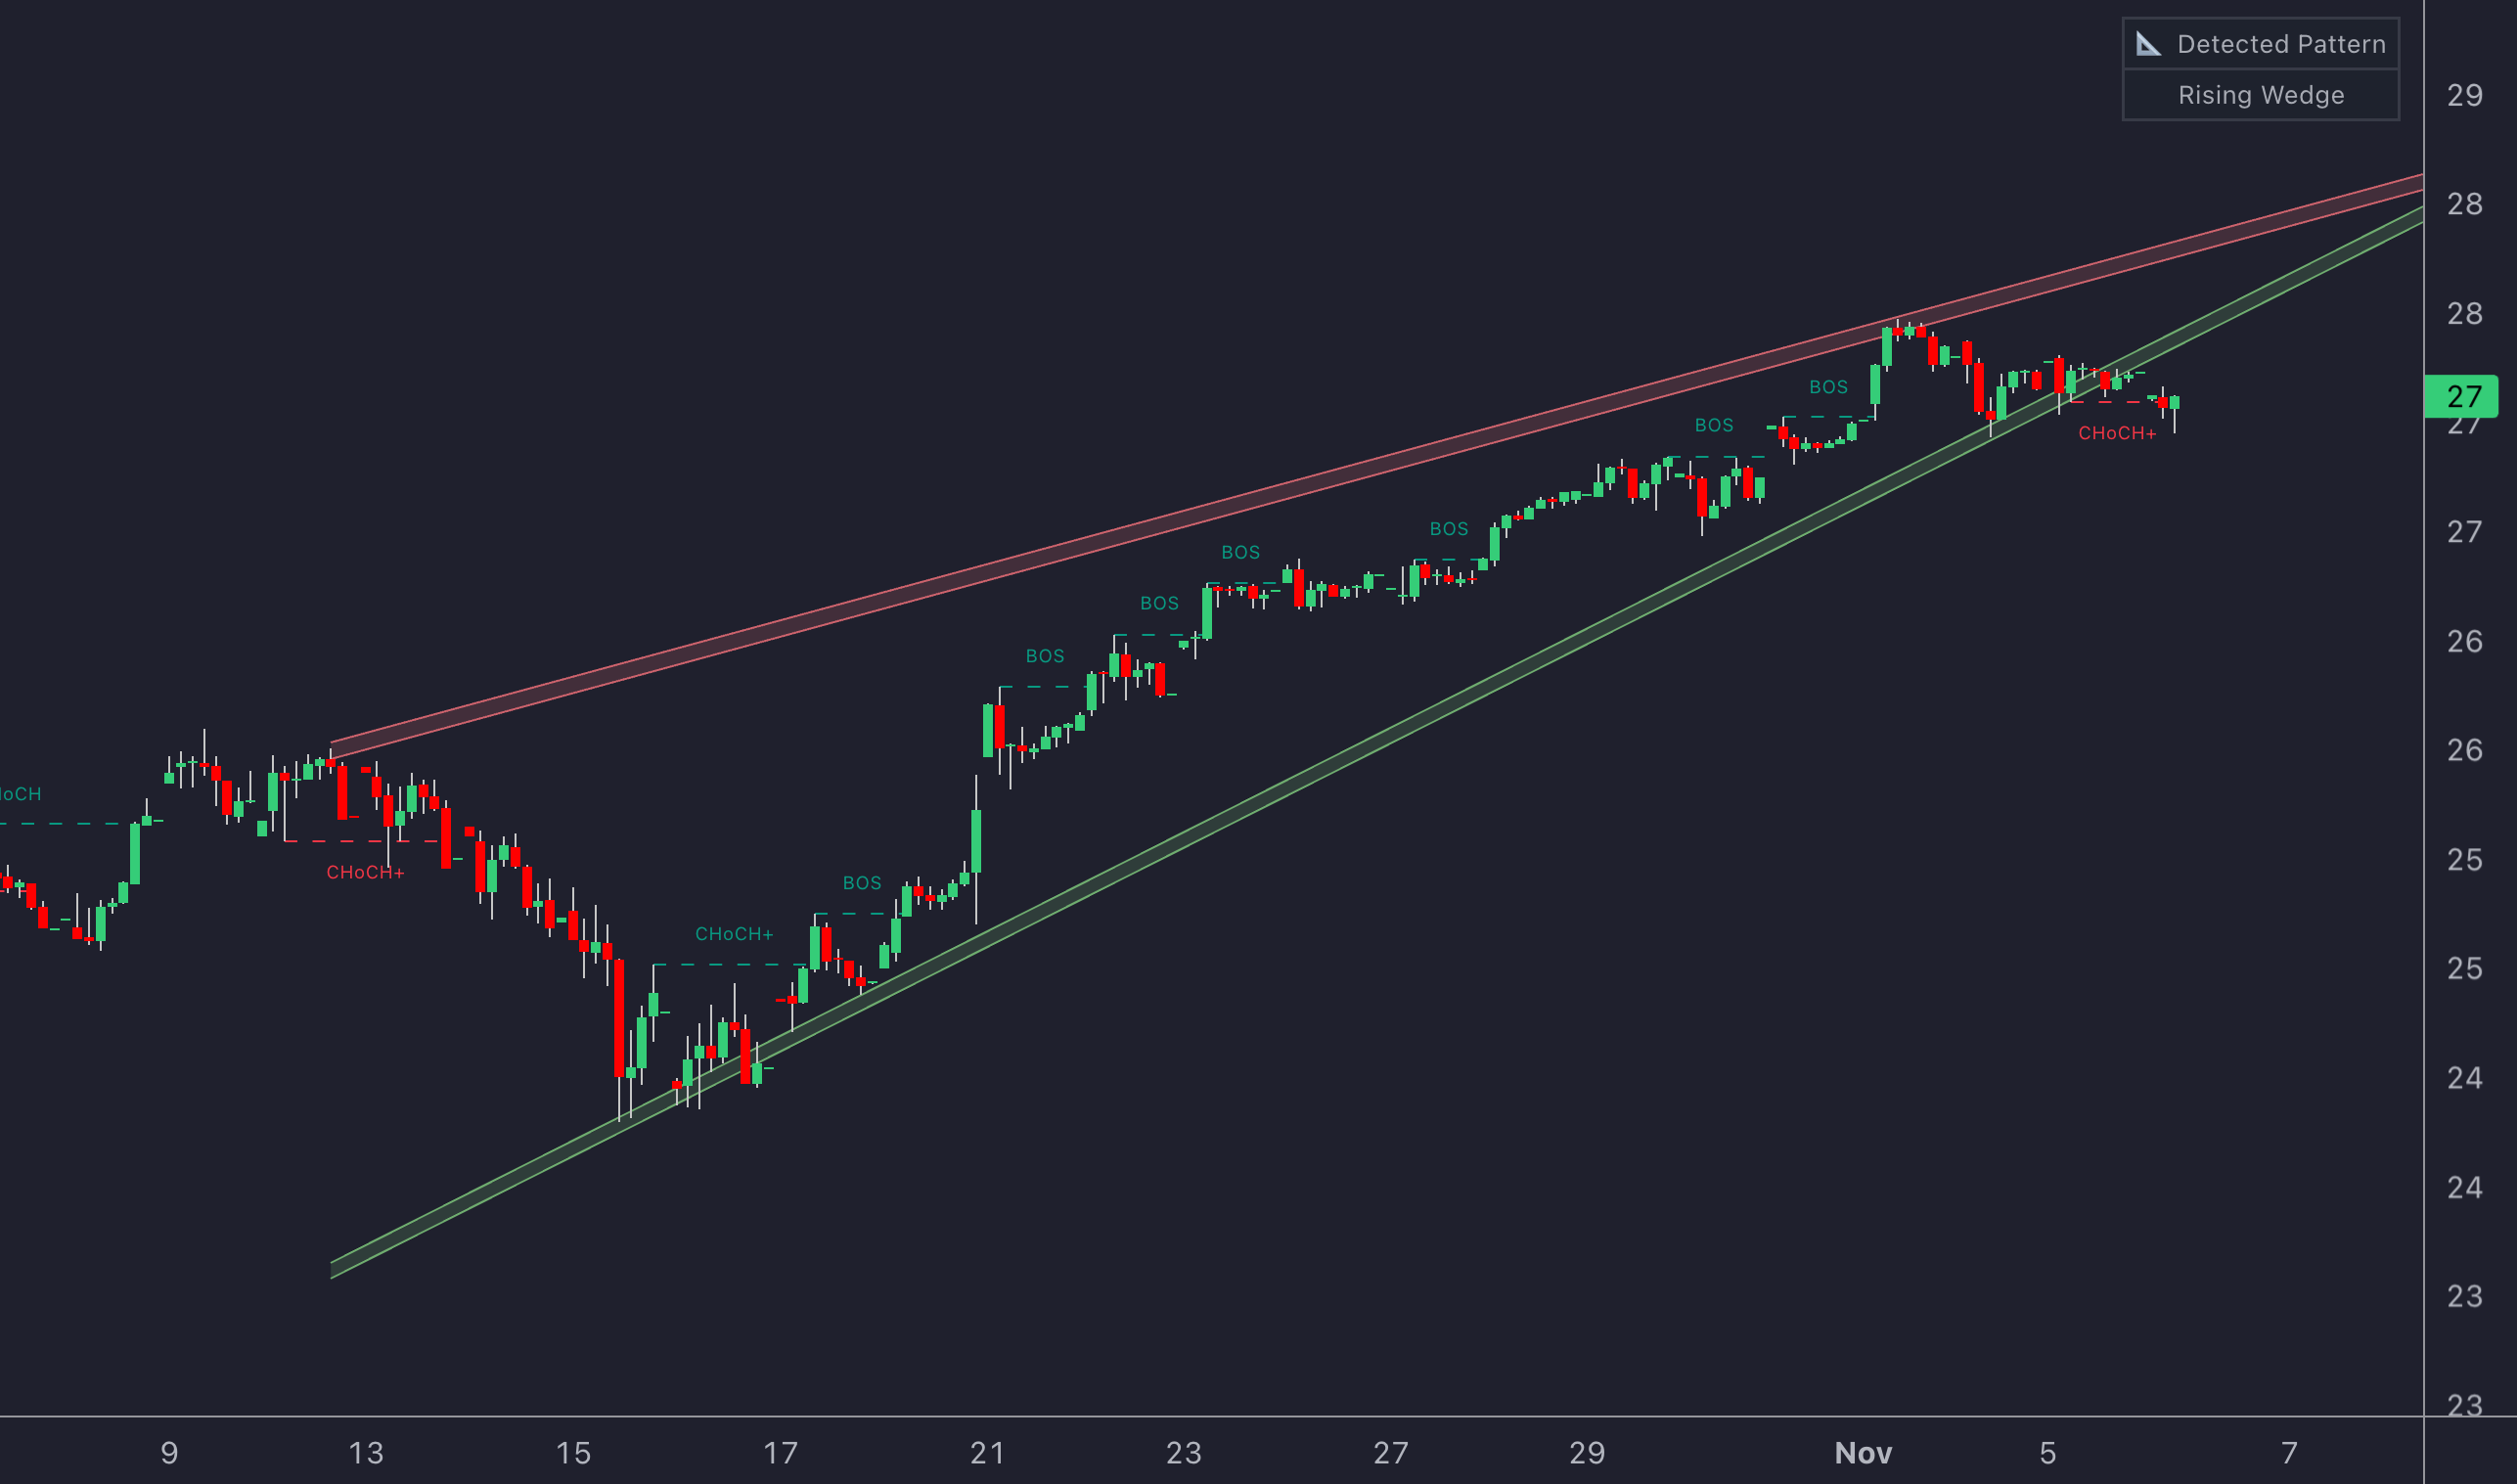
- Rising Wedge: Slopes upward and typically signals a bearish breakout.
- Falling Wedge: Slopes downward and often signals a bullish breakout.
Key Points to Remember:
- Both patterns are formed by converging trend lines over 10–50 periods.
- Declining volume during their formation hints at an upcoming breakout.
- Rising wedges indicate weakening buying momentum, while falling wedges suggest increasing buying pressure.
- Success rates: Rising wedges (81%) and falling wedges (74%) in bull markets.
| Pattern | Direction | Signal | Volume | Success Rate |
|---|---|---|---|---|
| Rising Wedge | Upward | Bearish | Declines, spikes at breakout | 81% in bull markets |
| Falling Wedge | Downward | Bullish | Declines, spikes at breakout | 74% in bull markets |
To trade effectively, confirm the pattern with at least three touches on both trend lines, wait for a breakout, and use volume and technical indicators like RSI or MACD for validation. Always manage risk with stop-loss orders and a proper risk-reward ratio.
How To Trade The Falling Wedge Pattern in Few Easy Steps
Structure of Wedge Patterns
Wedge patterns are formed by two converging trend lines and often point to possible reversals or breakouts in price movement.
Main Elements of Wedges
A wedge pattern is made up of two trend lines that come closer together, creating a narrowing price range. These lines are drawn from a series of data points over 10 to 50 trading periods. For the pattern to be valid, each trend line must be touched at least three times.
| Element | Rising Wedge | Falling Wedge |
|---|---|---|
| Support Line | Steeper upward slope | Downward slope |
| Resistance Line | Gradual upward slope | Steeper downward slope |
| Price Range | Narrows upward | Narrows downward |
| Pattern Duration | 10–50 periods | 10–50 periods |
| Minimum Touches | 3 on each trend line | 3 on each trend line |
These converging lines represent a phase of consolidation, where buyers and sellers are in balance. In a rising wedge, the support line climbs more sharply than the resistance line, while in a falling wedge, the resistance line descends at a steeper angle than the support line.
Volume Analysis in Wedges
Volume trends play a key role in confirming wedge patterns. Typically, both rising and falling wedges show a gradual drop in trading volume as the pattern forms. In a bearish rising wedge, increasing volume at price peaks may signal distribution and a potential reversal. A sharp spike in volume often accompanies the breakout, validating the pattern.
When identified correctly, wedge patterns are highly reliable. Falling wedges, for example, have a 74% success rate during bull markets, while rising wedges succeed 81% of the time. Both patterns can offer average potential profits of 38%. Up next, we’ll take a closer look at rising wedge patterns and how these insights apply to them.
Rising Wedge Analysis
Let’s dive deeper into the key traits of rising wedges, building on the basics of wedge structures.
How to Identify Rising Wedges
A rising wedge appears when upward trend lines converge, with the support line moving up more steeply than the resistance line. To confirm this pattern, you’ll need at least three touches on both lines and a noticeable drop in trading volume. This setup highlights weakening buying momentum, even as prices climb.
Here’s a quick breakdown:
| Component | Requirement | Why It Matters |
|---|---|---|
| Trend Lines | Upward-sloping convergence | Shows price compression |
| Support Line | Steeper than resistance | Signals fading momentum |
| Touches | Minimum of 3 per line | Validates the pattern |
| Volume | Declining | Confirms bearish outlook |
Downtrend Signals in Rising Wedges
Rising wedges often hint at a drop in buying strength. They can show up during an uptrend (indicating a possible reversal) or during a downtrend (acting as a brief counter-move before the decline continues). Their bearish nature comes from the gradual loss of upward momentum.
Rising Wedge Chart Examples
A good example is the Vanguard Financials ETF (VFH) from October 2022 to March 2023. During this period, the wedge showed higher lows at $72.96 and $80.37, and higher highs at $88.83 and $90.87. Volume steadily decreased, and on March 27 2023, the price broke downward to $74.09.
For effective trading decisions, focus on these key elements:
- A clear break below the lower trend line
- Confirmation with increased trading volume
- Signals from technical indicators like RSI or MACD
- Candle closure beneath the trend line
This groundwork prepares us for the analysis of falling wedges, which we’ll cover next.
Falling Wedge Analysis
Falling wedges are the bullish counterpart to rising wedges, signaling potential reversals with a 74% accuracy rate.
How to Spot Falling Wedges
A falling wedge takes shape when price movements create two downward-sloping trend lines that converge. The key is that the upper resistance line slopes down more gradually than the lower support line. Here’s what to look for:
| Component | Characteristic | Significance |
|---|---|---|
| Upper Line | At least 2–3 significant highs | Marks the resistance level |
| Lower Line | At least 2–3 significant lows | Defines the support level |
| Convergence | Lines form a cone-like shape | Signals momentum shift |
| Volume | Decreases during formation | Indicates market consolidation |
| Timeframe | Forms over 3–6 months | Adds credibility to the pattern |
These elements help confirm the formation of a falling wedge and set the stage for identifying bullish signals.
Uptrend Signals in Falling Wedges
The bullish potential of falling wedges becomes apparent when a prior downtrend starts losing steam. This pattern often leads to an uptrend 68% of the time. As the market begins forming higher lows while highs remain lower, it reflects increasing buying pressure, suggesting that buyers are stepping in.
Falling Wedge Chart Examples
Chart examples provide valuable visual context for understanding this pattern. To trade falling wedges effectively, keep these steps in mind:
- Ensure the downtrend has lasted at least three months, with decreasing volume during the wedge formation.
- Wait for a strong breakout above the upper resistance line.
- Confirm the breakout over several trading sessions before entering a trade.
With a 62% flashback rate, confirmation is key to leveraging the accuracy of this pattern before making a move.
Trading with Wedge Patterns
Trading wedge patterns effectively isn’t just about recognizing the structure – it’s about knowing exactly when to enter and exit trades.
When to Enter and Exit Trades
Timing is everything when trading wedge patterns. For a rising wedge, look to enter short positions after a confirmed breakdown below the lower trendline. For a falling wedge, enter long positions when the price breaks above the upper trendline.
| Pattern Type | Entry Signal | Exit Condition | Success Rate |
|---|---|---|---|
| Rising Wedge | Break below lower trendline | Target reached or stop-loss hit | 81% in bull markets |
| Falling Wedge | Break above upper trendline | Target reached or stop-loss hit | 74% in bull markets |
Setting Stop Loss and Profit Targets
To protect your trades, set a stop loss slightly beyond the breakout point to account for market noise. For profit targets, measure the height of the wedge pattern and project that distance from the breakout level. Use Fibonacci retracement levels (38.2%, 61.8%, and 100%) to set conservative, moderate, or aggressive goals.
Managing Trading Risk
Risk management is as important as timing. Limit your exposure to 1–2% of your trading capital per trade, adjusting based on the reliability of the pattern and market conditions.
Use additional tools like volume analysis to confirm breakouts. Decreasing volume during the formation of the wedge suggests reliability, while surging volume could indicate a potential failure. Also, aim for a risk-reward ratio of at least 1:2, meaning your potential reward should be at least twice the amount you’re risking. This approach helps protect your capital while taking advantage of both rising and falling wedge opportunities.
LuxAlgo Price Action Concepts Pattern Detection
The Price Action Concepts toolkit on TradingView automatically highlights classic price-action structures—wedge patterns, trend lines, liquidity zones, and more—directly on your chart. Its built-in Pattern Detection module scans every candle in real time, marking rising and falling wedges the moment they become tradable, so you no longer need to draw or update lines manually.
- Automatic Trend Lines – Support and resistance lines adjust dynamically as new price action unfolds.
- Real-time Alerts – Get notified the instant a wedge completes its third touch or breaks out.
- Volume Overlay – Optional volume shading helps confirm whether breakouts have institutional backing.
- Multi-Timeframe View – Detect patterns on higher timeframes while executing on lower ones for refined entries.
Because the toolkit applies the same rule-set to every market, you can backtest wedge signals across stocks, crypto, or forex and transfer those insights directly into live trading.
Advanced Wedge Pattern Methods
Using Technical Indicators
Pairing wedge patterns with tools like RSI, MACD, and Bollinger Bands can improve the reliability of your signals.
- RSI: Helps identify overbought levels (above 70) in rising wedges and oversold levels (below 30) in falling wedges.
- MACD: Confirms breakouts with bearish crossovers for rising wedges and bullish crossovers for falling wedges.
- Bollinger Bands: Measures volatility and highlights potential reversals when prices touch the outer bands.
Here's a quick breakdown:
| Indicator | Rising Wedge Signal | Falling Wedge Signal |
|---|---|---|
| RSI | Overbought (>70) | Oversold (<30) |
| MACD | Bearish crossover | Bullish crossover |
| Bollinger Bands | Price near upper band | Price near lower band |
When these indicators align with wedge patterns, the chances of spotting valid breakouts improve. However, it’s equally important to steer clear of misleading signals.
Avoiding False Breakouts
False breakouts can be costly, so it’s crucial to confirm moves beyond support or resistance levels. One effective method is to wait for a candle to close firmly outside these levels before taking action. For example, an analysis of USD/JPY daily charts revealed that jumping in immediately after a breach often leads to false signals.
Choosing the Right Timeframe
Timeframe selection is another key factor in refining wedge pattern analysis. To increase accuracy:
- Use daily and weekly charts for more dependable signals.
- Focus on patterns that form over 3–6 months for better reliability.
- Cross-check patterns across multiple timeframes to confirm consistency.
Common Trading Mistakes
When trading wedge patterns, it's easy to fall into common traps. Here's how to steer clear of them and make smarter trading decisions.
Pattern Recognition Errors
One frequent mistake is confusing wedge patterns with triangle patterns. The key difference? The angles and direction of the trend lines.
Here’s how to avoid misidentifying patterns:
- Check the trend lines: Both should move in the same direction – upward for rising wedges, downward for falling wedges.
- Ensure convergence: The trend lines must clearly converge at measurable angles.
Missing Confirmation Signals
Jumping into trades without proper confirmation can be costly. Volume analysis, though often ignored, plays a crucial role in confirming wedge patterns.
Here are the main confirmation signals to look for:
| Confirmation Element | Rising Wedge | Falling Wedge |
|---|---|---|
| Volume decline | Confirms pattern | Confirms pattern |
| Breakout Volume | Increases on downward break | Increases on upward break |
| Price Action | Close below support | Close above resistance |
| Prior Level Break | Below previous support | Above previous resistance |
"While wedge patterns are powerful tools, it's crucial not to solely base your trading decisions on them. Markets are complex, and relying on a single pattern might lead to missed opportunities or incorrect predictions. Always consider other technical indicators, fundamental analysis, and market sentiment to supplement your pattern analysis." – Anastasia Bubenko, Expert
Ignoring these confirmation signals can lead to errors that might hurt your trading outcomes.
Over-Reliance on Wedges
Relying too heavily on wedge patterns can be risky. For example, Bitcoin's ascending wedge in July 2024 broke with increased volume, showing how focusing solely on the pattern without broader analysis can result in losses.
To avoid this pitfall, build a well-rounded strategy:
- Use wedge analysis alongside other technical indicators.
- Factor in fundamental analysis and current market conditions.
- Set stop-loss levels based on multiple inputs, not just the pattern.
- Always stick to solid risk management practices, no matter how confident you feel about a pattern.
Conclusion
Main Points Review
Wedge patterns are key tools in technical analysis when identified and traded correctly. A rising wedge often points to bearish reversals with breakouts below the support line, while a falling wedge suggests bullish reversals with upward breakouts. Falling wedge patterns, in particular, have demonstrated a 74% success rate in bull markets, offering an average profit potential of +38%. To use them effectively, confirm the trendlines are converging, watch for declining volume during the pattern's formation, and wait for clear breakout signals.
Implementation Guide
This guide has outlined how wedge patterns can serve as practical trading signals. Here's how to put these insights into action:
- Pattern Validation: Ensure the trendlines are converging, observe volume decline during the wedge's formation, and wait for a breakout confirmed by increased volume. Use additional technical indicators to strengthen your analysis.
- Risk Management: Define clear entry and exit points based on the pattern's measurements. For falling wedges, set stop-loss orders below the lower trendline; for rising wedges, place them above the upper trendline.
- Strategic Integration: Incorporate wedge analysis into your broader technical analysis strategy. Pay close attention to volume patterns to confirm price movements.


