CAGR
 By LuxAlgoAug 9, 2026
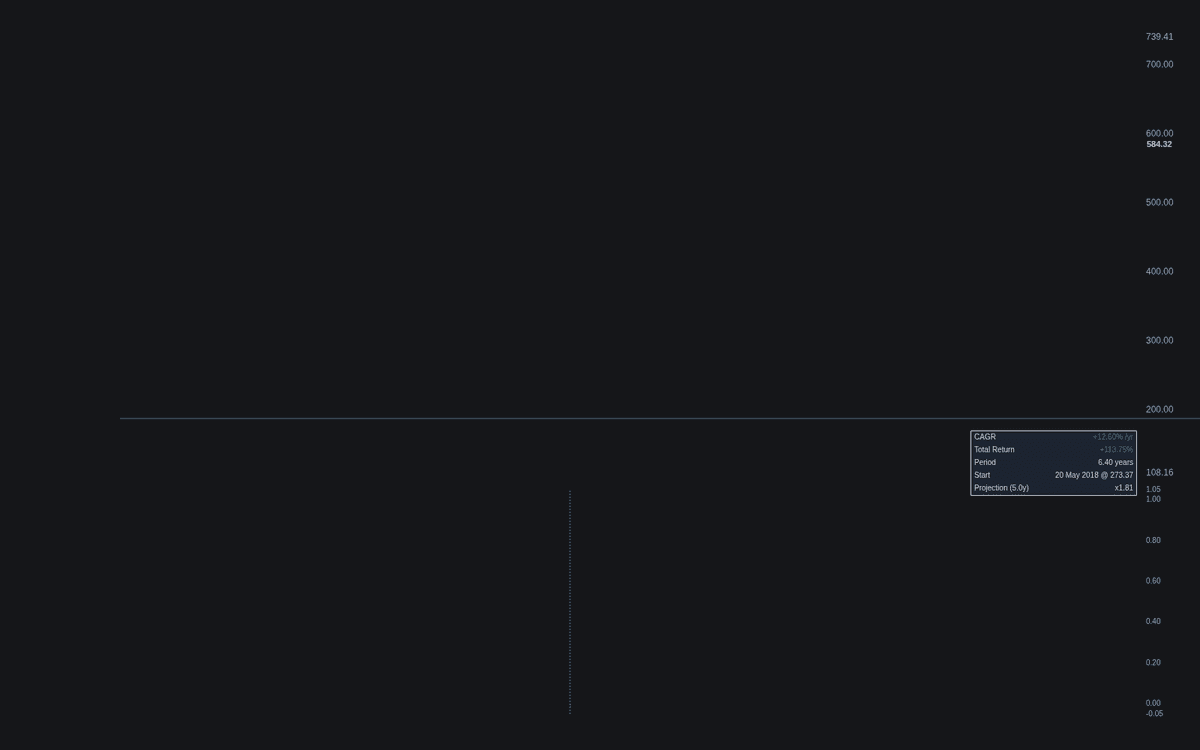
CAGR plots CAGR — the constant yearly rate that compounds a starting value into an ending value — as a live pane series rather than a one-off statistic, the first native implementation of the concept. The measured period is the whole chart, everything after a custom date, or a rolling window ending at the current bar; elapsed time converts to years on a calendar basis (days over 365.25) or a trading basis (sessions over 252). It refuses to annualize samples under one year unless told to, reporting the unannualized total return instead.
How to Trade the CAGR?
- CAGR above zero: the measured period compounds positively; alerts cover zero and threshold crosses in both directions.
- Rolling Window mode: turns the figure into a time series — a rolling CAGR sliding lower reveals growth decay an anchored measurement hides.
- "(extrapolated)" flag: marks any annualized sub-year figure — a short sample projected to a full year routinely overstates what is sustainable.
- Projection row: the growth multiple after the chosen years if the rate persists — with all the fragility that assumption carries.
CAGR Settings
- Source (default close): the series measured as an account value.
- Measure From (default First Bar): also Custom Date or Rolling Window.
- Start Date (default 01 Jan 2024): the Custom Date anchor.
- Rolling Window (Years) (default 3): displays only once history covers the window.
- Year Basis (default Calendar Days (365.25)): trading basis counts sessions over 252, reverting to calendar time above daily.
- Annualize Periods Under 1 Year (default disabled): extrapolate short samples, flagged on the dashboard.
- CAGR Threshold (% / Year) (default 10) with Show Threshold Level (default disabled): the alert level and its dashed line.
- Dashboard toggles include the Projection Row (default enabled, 5 years); style adds Plot Total Return (default disabled) and Mark Period Start (default enabled).
Frequently Asked Questions
Why is my CAGR hidden while total return shows?
Less than one year has elapsed and annualization is off, so the pane shows nothing rather than an extrapolated rate. Enable Annualize Periods Under 1 Year to force the figure, flagged as extrapolated.
How sensitive is CAGR to the start date?
Very — starting at a low versus a high changes the rate materially. Comparing the three anchor modes on the same chart shows how much of the number is starting-point luck.
Does CAGR account for risk?
Not at all: two series can share one CAGR yet travel very different paths. The Calmar Ratio build divides this same annualized rate by maximum drawdown — the natural next step when the path matters.

The Library is free. Quant makes it yours.
Pull any concept or indicator into Quant: rebuild it, retune it, or turn it into a backtested strategy of your own.