All indicators

Cubic Bézier Curve Extrapolation

By LuxAlgoMar 7, 2022

Static chart image
ForecastingDrawing Tool

The Cubic Bézier Curve Fit script stands out as a versatile drawing tool that empowers traders and analysts to project price trends by utilizing custom control points. These curves are not only an artistic marvel but also a powerful technical analysis tool due to their extrapolation prowess. By fitting a Cubic Bézier Curve using four control points, users can effortlessly estimate underlying price dynamics and even forecast future trends.

Key Settings for Optimal Use

  • Extrapolation Length: Determines the number of observations projected forward, allowing users to anticipate future market movements.
  • Source: This input refers to the data source the script utilizes in calculations.

Style Customization

  • Width: This setting adjusts the thickness of the Bézier curve line to enhance visual clarity on the chart.
  • Colors: The curve dynamically changes color based on its direction – a primary hue for rising trends and a secondary one for declining trends.

Other critical settings involve placing the control points on the chart, ensuring minimal setting adjustments. Users simply reposition these points as they would with any standard drawing tool, a necessary step when incorporating the indicator into a chart analysis.

How to Use the Cubic Bézier Curve for Trading?

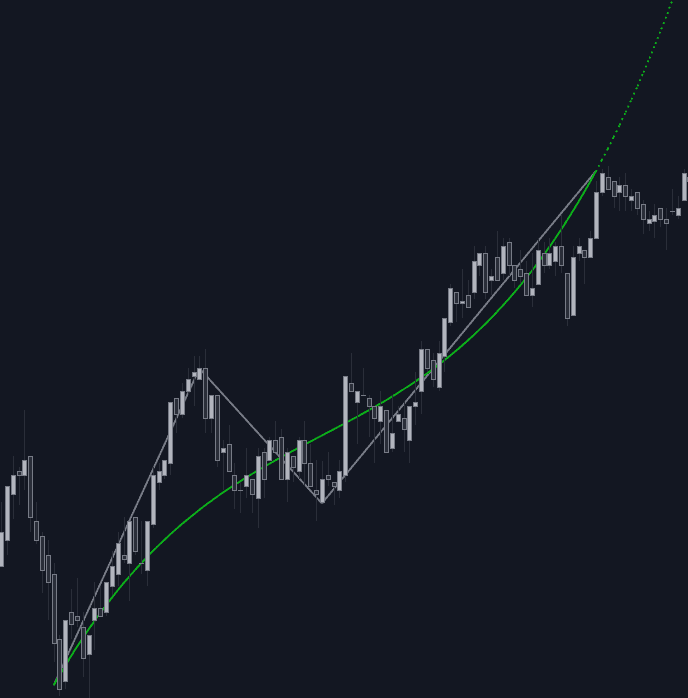
Visual of Bézier curve usage

Bézier curves find extensive application in multiple scientific and creative disciplines. Their inclusion in technical analysis brings immense value due to their unique capacity for extrapolation and straightforward computation.

A four-point control structure defines a cubic Bézier curve, offering flexibility in identifying maximas and minimas, or in positioning them to capture recent price trend nuances more accurately.

Detailed Bézier curve image

While Bézier curves excel in many areas, they prioritize smooth curve fitting over exact data correlation. For users focused on achieving a precise fit, rational Bézier curves may offer alternative benefits.

Delving Into Bézier Curve Mechanics

The essence of Bézier curves resides in nested linear interpolation across the control points, producing smoothly transitioning paths. The curves initiate at the first control point and terminate at the last, maintaining a direct line to their respective controls regardless of the overall path shape. Instead of traditional interpolation, this script employs a polynomial approach, infusing flexibility and explicit control over the curve's shape.

The complexity is directly tied to the number of control points – a defining feature where the degree of the curve is one less than the number of points. This allows users to replace interpolation with polynomial equations for a better-detailed market analysis.

Frequently Asked Questions (FAQ)

What are the advantages of using a Cubic Bézier Curve in trading?

Cubic Bézier Curves provide a visual representation of market trends, assisting in identifying potential future price movements through extrapolation. They offer a blend of artistic fluidity and analytical precision.

How can I access the Cubic Bézier Curve Fit tool?

You can get access on the LuxAlgo Library for charting platforms like TradingView, MetaTrader (MT4/MT5), and NinjaTrader for free.

Are Bézier Curves suitable for all types of trading analysis?

While they are highly versatile and easy to use with minimal settings adjustment, traders seeking a more precise data fit may consider rational Bézier curves as an alternative.

Free indicator

Get free access to this indicator on the platforms below.

TradingView
NinjaTrader
MetaTrader 4/5

Unlock the entire LuxAlgo Library

Every indicator, every strategy, full charts, and complete access to Quant — our AI agent.