Day Of Week Price Distribution
 By LuxAlgoFeb 18, 2026
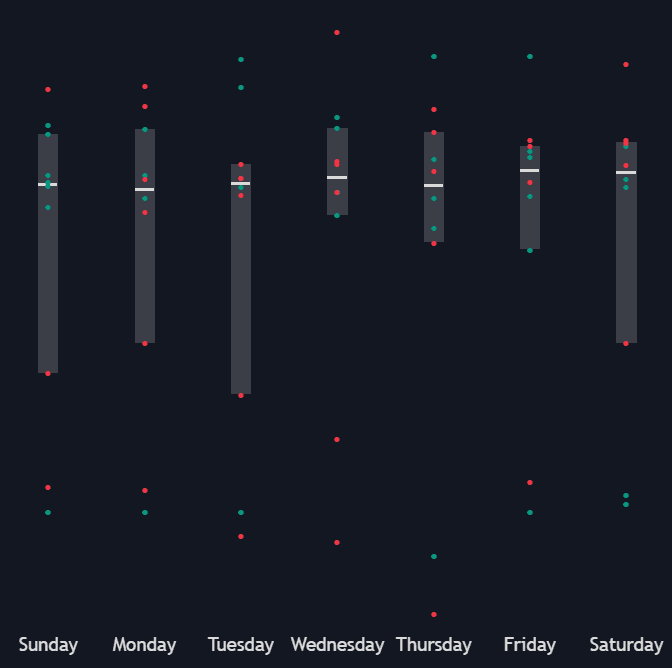
The Day of Week Price Distribution is a powerful trading indicator that visualizes how closing prices behave on each weekday over a user-defined number of weeks. By combining statistical box plots with interactive data points and a performance dashboard, this tool helps traders uncover recurring patterns, volatility tendencies, and day-specific price behavior at a glance. Whether you are building a short-term trading strategy or studying historical price structure, this indicator transforms raw data into actionable insights.
How to Trade the Day of Week Price Distribution Indicator?
Using this trading indicator is simple yet highly informative. Traders can select:
- Window (10 weeks by default): Defines how many weeks of historical data are analyzed.
- Spacing (20 by default): Adjusts the visual width and separation of each weekday box plot.
Once applied to the chart, the indicator organizes closing price data into five distinct box plots — one for each weekday. This statistical representation allows traders to quickly identify:
- Which weekdays tend to close higher or lower
- Where volatility clusters
- Whether certain days frequently produce outliers
- If distributions are tightening or expanding over time
This makes it a valuable companion for day traders, swing traders, and quantitative analysts looking to refine entry timing or filter trades by weekday bias.
Understanding the Box Plot Structure
Each weekday is represented with a complete statistical distribution model:
-
Box (IQR – Interquartile Range):
The rectangle represents the 25th to 75th percentile range. This shows where the majority of closing prices cluster. -
Median Line (50th Percentile):
The line inside the box indicates the median closing price for that weekday. -
Dots (Individual Data Points):
Each dot represents a single closing price from the selected period.
Hovering over a dot reveals:- Closing price
- Daily price change (delta from open to close)
- Volume
- Date
This granular visibility makes the indicator more than just a visual tool — it becomes an interactive statistical engine.
Identifying Outliers and Market Behavior
Outliers (dots located far outside the box) are particularly important in trading strategy development. They may signal:
- News-driven moves
- High-impact economic events
- Abnormal volatility spikes
- Institutional participation
By recognizing these deviations, traders can adjust risk management and position sizing for specific weekdays.
As shown above, increasing the data window leads to smoother, more uniform distributions. A smaller window highlights short-term regime shifts, while a larger window emphasizes long-term weekday tendencies.
Core Dashboard Metrics for Data-Driven Trading
The integrated dashboard enhances the analytical depth of this trading indicator by displaying essential statistics for the selected window:
- Highest Price: Maximum closing price in the dataset
- Lowest Price: Minimum closing price in the dataset
- Most Bullish Delta: Largest open-to-close price increase
- Most Bearish Delta: Largest open-to-close price decrease
- Largest Volume: Day with the highest trading volume
- Smallest Volume: Day with the lowest trading volume
These metrics allow traders to quickly evaluate:
- Which weekday historically delivers the strongest bullish momentum
- Which day carries the highest downside risk
- Where volume concentration occurs
- Whether volatility aligns with participation
This is especially useful when integrating the indicator into a broader trading strategy involving trend filters, volatility tools, or liquidity-based systems.
Why Use Day-of-Week Analysis in Your Trading Strategy?
Market behavior is not random. Institutional flows, economic releases, options expirations, and macro events often cluster on specific weekdays. By analyzing structured weekday distributions, traders can:
- Optimize entry timing
- Avoid statistically weaker days
- Align breakout strategies with high-volatility sessions
- Improve mean-reversion setups on historically balanced days
The Day of Week Price Distribution indicator turns historical tendencies into measurable trading edges.
Indicator Settings Explained
Window
Select the number of weeks used to gather historical data.
- Smaller windows capture recent market conditions.
- Larger windows provide more stable statistical averages.
Spacing
Controls the visual width of the box plots.
Higher spacing values create larger boxes for clearer visual comparison.
Dashboard Settings
- Dashboard: Enable or disable the statistical panel.
- Position: Choose where the dashboard appears on the chart.
- Size: Adjust the dashboard scale to match your layout.
Style Customization
- Bullish Color: Define the color for bullish price movements.
- Bearish Color: Define the color for bearish price movements.
- IQR Area: Customize the box color. Enable Auto to use the default scheme.
- Median Line: Customize the median color. Enable Auto for automatic styling.
Who Is This Trading Indicator For?
The Day of Week Price Distribution is ideal for:
- Day traders seeking weekday bias confirmation
- Swing traders analyzing recurring weekly structures
- Quantitative traders validating statistical assumptions
- Algorithm developers incorporating time-based filters
- Portfolio managers studying volatility clustering
It can be applied to stocks, forex, crypto, indices, and futures markets.
Frequently Asked Questions (FAQ)
What does the Day of Week Price Distribution indicator show?
It shows the statistical distribution of closing prices for each weekday over a selected number of weeks, including the interquartile range, median, individual data points, and key performance metrics.
How can this improve my trading strategy?
By identifying weekday tendencies, volatility clusters, and outliers, traders can refine entry timing, improve risk management, and align strategies with statistically favorable sessions.
Does this indicator work on all markets?
Yes. It works on any market with consistent weekday trading sessions, including stocks, forex, crypto, indices, and futures.
How do I access the Day of Week Price Distribution indicator?
You can get access on the LuxAlgo Library for charting platforms like TradingView, MetaTrader (MT4/MT5), and NinjaTrader for free.
Free indicator
Get free access to this indicator on the platforms below.

Unlock the entire LuxAlgo Library
Every indicator, every strategy, full charts, and complete access to Quant — our AI agent.