Equity-curve-based Throttling
 By LuxAlgoJun 27, 2026
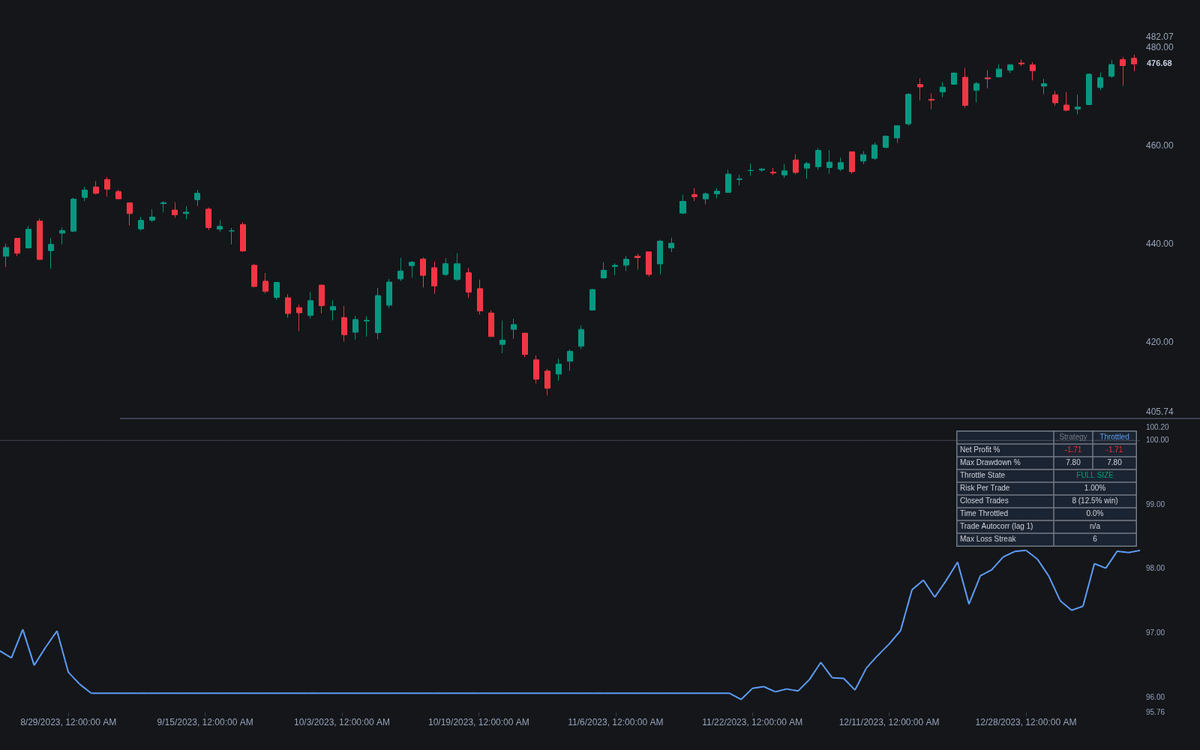
Equity-curve-based Throttling makes equity-curve-based throttling observable end to end: a built-in reference strategy supplies the trades, the selected rule reads that strategy's own closed-trade equity curve, and both curves — untouched and throttled — plot side by side with a fill where they diverge. Signals are never altered; the throttle only decides how much capital each one receives.
How to Trade the Equity-curve-based Throttling?
- Equity MA Filter: full size while closed-trade equity sits at or above its trade-count average, reduced below it.
- Drawdown De-Risk Steps: each further drawdown step multiplies risk by the de-risk factor, sticky until a new high or the set recovery restores it.
- Losing Streak: a run of consecutive losers switches to reduced size; one winner resets it.
- State at a glance: amber background while reduced, red while halted; the dashboard reports both curves' stats plus the lag-1 trade autocorrelation and longest losing streak that justify throttling.
Equity-curve-based Throttling Settings
- System (default Moving Average Cross): also RSI Mean Reversion and Donchian Breakout, via Fast MA (20), Slow MA (50), RSI Length (14) and Donchian Length (20).
- ATR Length (default 14) and Stop x ATR (default 2.0): the hard stop each trade carries, also used to size positions.
- Base Risk Per Trade % (default 1.0): fixed-fractional risk at full size.
- Rule (default Equity MA Filter) with Equity MA (closed trades) (30), Reduced Size % (0 = skip signals), Drawdown Step % (10), De-Risk Factor (0.5), Restore After Recovering % (50) and Losing Streak Trigger (3).
- Circuit Breaker (default off) with Max Loss % (5) and Period (Week): a hard floor halting trading until the next period.
- Display: Show Dashboard (on) plus curve, fill and background toggles.
Frequently Asked Questions
How does throttling differ from the Kelly Criterion?
The Kelly Criterion sizes from an estimate of the strategy's edge and holds that size while the estimate stands. Throttling is reactive: it cuts size when the recent curve deteriorates and makes no claim about the edge.
Why does the strategy curve keep trading while throttled?
Every rule reads the strategy's own closed-trade curve, which paper trades keep updating at zero size; if throttled equity were the input, the curve would freeze and the throttle could never see the recovery that releases it.
Can it throttle my own strategy?
It ships with three reference systems and does not import external trade lists. Study how each rule behaves here before wiring the logic into your own execution.

The Library is free. Quant makes it yours.
Pull any concept or indicator into Quant: rebuild it, retune it, or turn it into a backtested strategy of your own.