HTF Candle Dynamics
![]() By LuxAlgoFeb 19, 2026
By LuxAlgoFeb 19, 2026
The HTF Candle Dynamics indicator provides traders with a comprehensive view of Higher Timeframe (HTF) price action and volume distribution directly on their lower timeframe charts. By projecting the current developing HTF candle and its internal volume characteristics to the right of the price, users can maintain high-level context without switching tabs.
Note: Ensure the chart timeframe is lower than the selected HTF setting for the indicator to function correctly.
USAGE
This tool is designed to bridge the gap between execution timeframes and higher-level market structures. It is particularly useful for scalpers and day traders who need to stay aware of Daily or Weekly levels while trading on 1-minute or 5-minute charts.
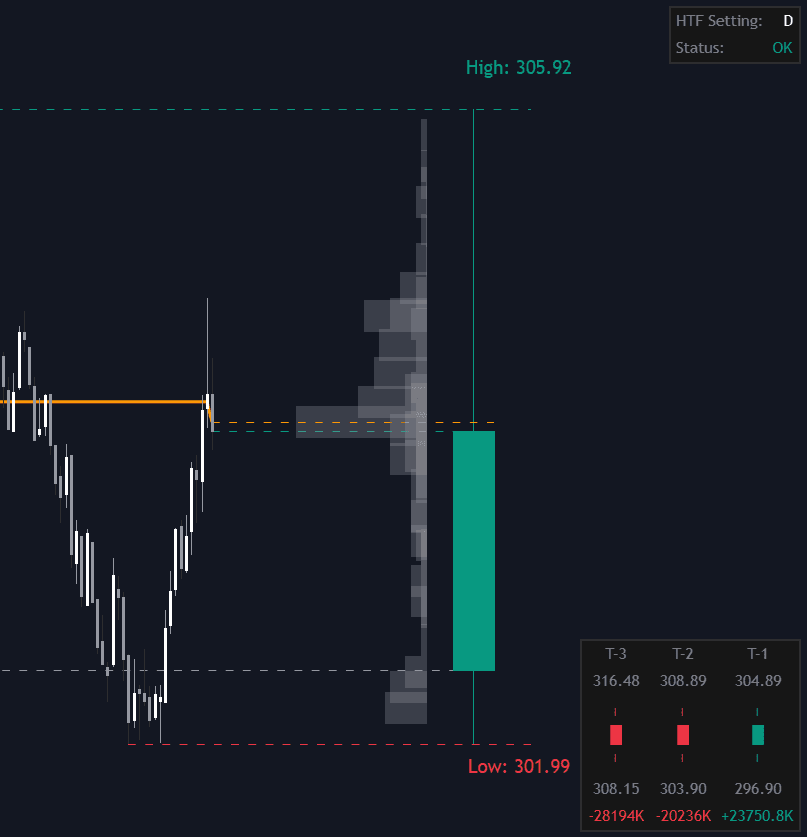
HTF Candle Projection
Visualizes the current HTF period (e.g., Daily, Weekly) as a dynamic candle on the right side of the chart. It includes projections for the HTF Open, High, Low, and Close levels. These levels often act as significant psychological barriers where price might find support or resistance.
Intraday Volume Profile
Generates a volume profile specifically for the current HTF period. This allows traders to see where the most volume is being transacted within the developing candle. Identifying "High Volume Nodes" within the current HTF candle can signal where institutional interest is concentrated.
Dynamic POC Tracking
A polyline tracks the movement of the Point of Control (POC) throughout the HTF period, showing how the most traded price level has shifted over time. If the POC is trending upward alongside price, it confirms a healthy bullish trend; if price moves away from a static POC, it might indicate a potential mean reversion back to that high-volume level.
How to Use
Traders can utilize this indicator to align their intraday trades with the broader market direction:
- Identifying Value: Use the Intraday Volume Profile to spot the Point of Control. If the price is trading above the POC, the market is currently in a premium zone for that HTF. If it is below, it may be considered "discounted" relative to the volume transacted so far.
- Breakout Confirmation: When price breaks the High or Low of the projected HTF candle, traders look for volume expansion within the profile to confirm if the breakout has significant participation.
- Mean Reversion: The Dynamic POC line acts as a magnet. If price overextends significantly from the POC line, traders often look for signs of exhaustion to play a move back toward the high-volume area.
DETAILS
The indicator uses security calls to fetch historical HTF data while calculating the current developing period in real-time. A dedicated status table ensures the selected HTF is valid relative to the chart timeframe to prevent calculation errors.
History Dashboard
The dashboard provides a statistical breakdown of the previous three HTF candles (T-1, T-2, T-3). This is crucial for "Contextual Trading." By seeing the OHLC values and Volume Delta of the previous periods, you can determine if the market is experiencing "Expansion" (increasing volume and candle size) or "Contraction" (decreasing volume and tighter ranges).
Volume Delta
The Volume Delta shown in the history dashboard is an approximation calculated by summing volume based on the direction of individual intraday candles.
SETTINGS
- HTF Setting: Defines the timeframe for the candle projection and volume profile (default is "D").
- Right Offset: Adjusts the horizontal position of the projected candle and labels to avoid overlapping with price.
- Visuals: Full control over bullish/bearish colors, POC lines, and projection offsets.
- Volume Profile: Toggle the profile visibility and customize the number of rows or the maximum width of the bars.
- History Dashboard: Toggle the history dashboard and adjust its position (Top Right, Bottom Right, etc.) or size.
Free indicator
Get free access to this indicator on the platforms below.
Unlock the entire LuxAlgo Library
Every indicator, every strategy, full charts, and complete access to Quant — our AI agent.