Internal Pivot Pattern
![]() By LuxAlgoJul 30, 2025
By LuxAlgoJul 30, 2025
The Internal Pivot Pattern trading indicator is designed to help traders identify market pivots much earlier than traditional pivot detection methods. Unlike standard approaches that require several completed bars before confirming a swing high or low, this indicator leverages lower timeframe data within the current candle to detect pivots in near real-time. This means traders can spot potential trend reversals or continuations without waiting for multiple bars to form.
Featuring customizable candle colors, zigzag lines, and an integrated accuracy dashboard, the Internal Pivot Pattern indicator makes it easier to visualize uptrends, downtrends, and overall market structure directly on your chart.
How to Trade with the Internal Pivot Pattern Indicator
Traditionally, a pivot forms when the middle candle within a set interval (e.g., 21 bars) is the highest (pivot high) or lowest (pivot low). While effective for identifying swing highs and lows, this approach introduces significant lag because traders must wait for additional candles to confirm the pattern.
The Internal Pivot Pattern solves this by examining the lower timeframe data of the current candle. This allows the indicator to evaluate whether a pivot exists immediately upon candle close, giving traders much faster insights into potential market turning points.
- Pivot Low (Uptrend Signal): Indicates a possible bullish reversal or trend continuation.
- Pivot High (Downtrend Signal): Indicates a possible bearish reversal or downtrend continuation.
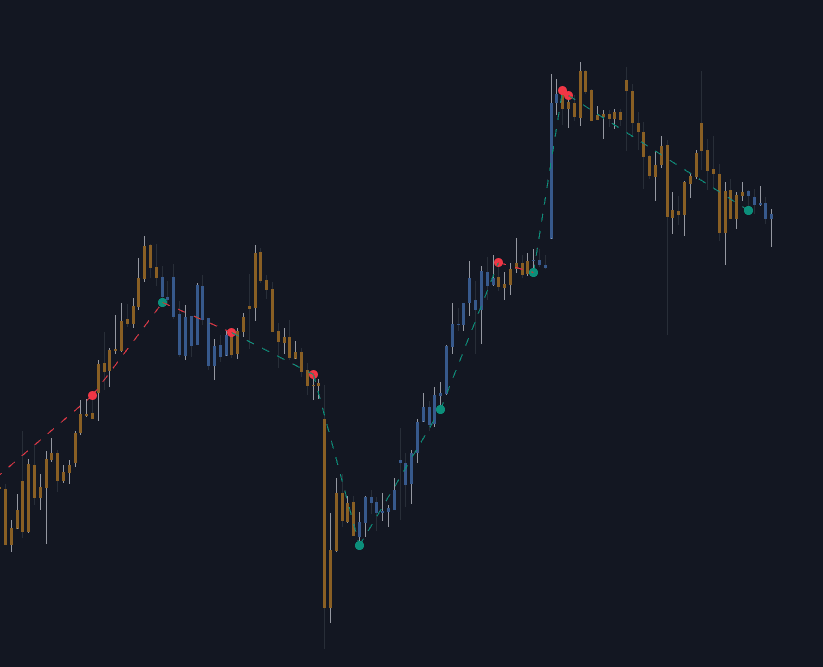
The indicator colors candles based on the most recent detected pivot:
- Blue candles: Latest pivot is a low → suggesting an uptrend.
- Orange candles: Latest pivot is a high → suggesting a downtrend.
Optimizing Timeframes for Pivot Detection
The Timeframe setting controls how much lower timeframe data is analyzed for detecting internal pivots.
- A much lower timeframe compared to your chart timeframe evaluates more granular data, leading to fewer but stronger pivot signals.
- A closer timeframe results in more frequent detections but may also produce more false signals.
This flexibility allows traders to adjust sensitivity based on their trading style, whether scalping, day trading, or swing trading.
Using the Accuracy Dashboard
The Accuracy Dashboard measures how reliable the detected pivots are.
- A pivot low is considered accurate if the next pivot detected is higher than the previous one.
- A pivot high is accurate if the subsequent pivot is lower, indicating lower lows.
By monitoring the accuracy percentage, traders can fine-tune the timeframe setting to improve the reliability of internal pivot signals and reduce false positives.
Indicator Settings
- Timeframe: Select the lower timeframe for detecting internal swings.
- Accuracy Dashboard: Enable or disable the real-time accuracy panel.
Style Customization
- Internal Pivot High: Set the dot color for detected pivot highs.
- Internal Pivot Low: Set the dot color for detected pivot lows.
- Zig-Zag: Customize the color of lines connecting each pivot.
- Candle Coloring: Enable trend-based candle coloring with full control over uptrend and downtrend colors.
FAQ
What makes the Internal Pivot Pattern different from standard pivot indicators?
Traditional pivots require multiple bars to confirm highs and lows, causing delays. This indicator uses lower timeframe data from the current candle to detect pivots much earlier, allowing for faster trend identification.
Can I use this for both uptrends and downtrends?
Yes. Pivot lows highlight potential bullish moves, while pivot highs indicate potential bearish reversals.
Does the Accuracy Dashboard help improve trading results?
Absolutely. The dashboard shows how often pivots correctly forecast higher highs or lower lows, helping you optimize your settings for better trade accuracy.
How can I access the Internal Pivot Pattern indicator?
You can get access to the Internal Pivot Pattern on the LuxAlgo Library, available for popular charting platforms like TradingView, MetaTrader (MT4/MT5), and NinjaTrader for free.
Free indicator
Get free access to this indicator on the platforms below.
Unlock the entire LuxAlgo Library
Every indicator, every strategy, full charts, and complete access to Quant — our AI agent.