


Market Performance by Yearly Seasons
Jan 29, 2025
The Market Performance by Yearly Seasons trading indicator is a powerful analytical tool for traders looking to optimize their strategies by understanding seasonal market trends. By assessing the average returns for each of the four seasons and examining raw returns for individual seasons over the years, traders can gain insights into potential trading strategies that align with seasonal patterns. This trading indicator is an excellent addition to any trader's toolkit, providing an edge in market analysis.
How to Trade with the Market Performance by Yearly Seasons Indicator?
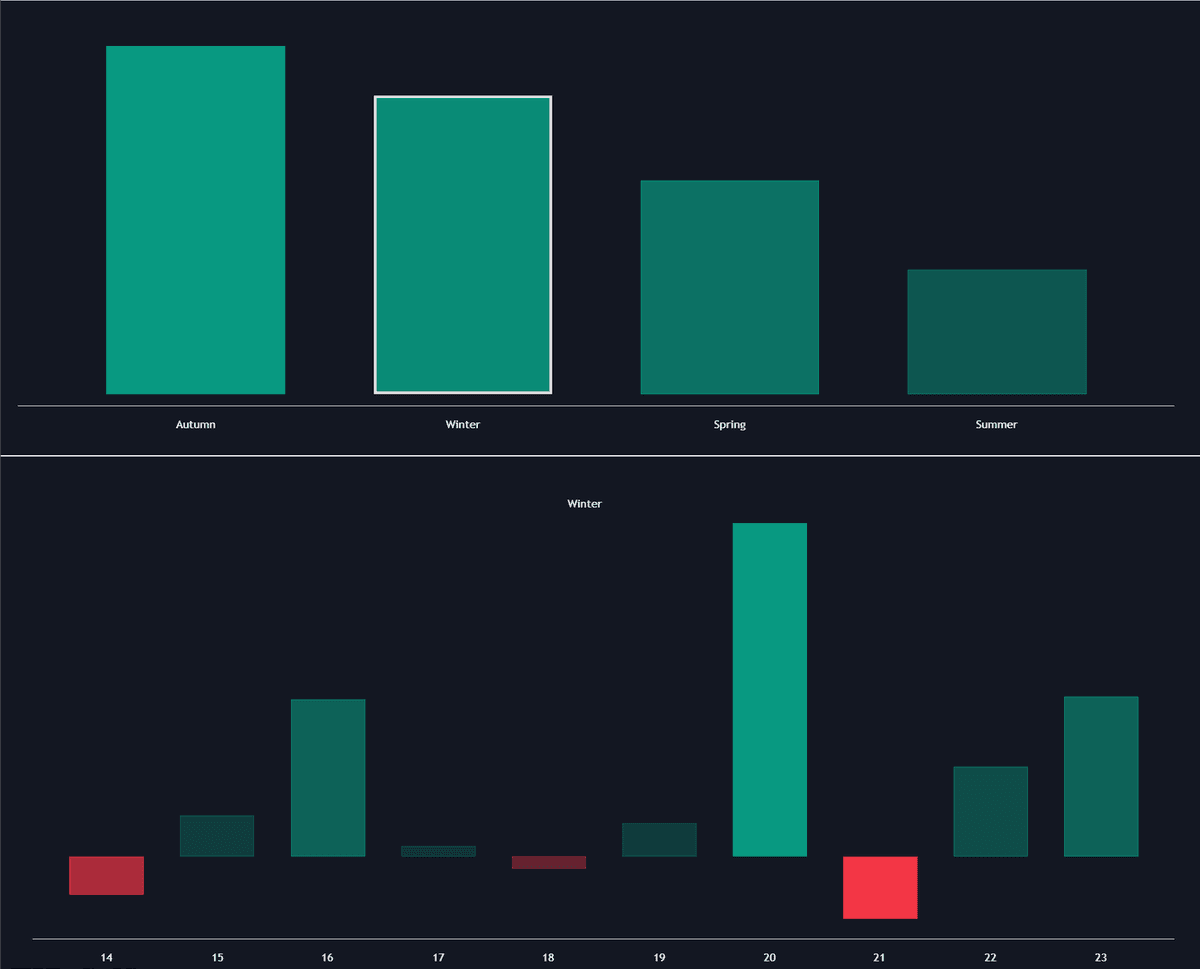
The Market Performance by Yearly Seasons indicator is designed to display average seasonal returns over a 10-year period with easy-to-interpret bar charts, helping traders to quickly identify the best times of the year for buying or selling assets. The current trading session is highlighted to provide clear visual guidance, enhancing the trader's situational awareness.
For detailed analysis, you can also opt to view raw returns for each season separately. This functionality allows traders to delve deeper into specific timeframes, aiding in the development of fine-tuned trading strategies.
Understanding Hemispheric Differences
One unique feature of this trading indicator is its ability to accommodate hemispheric differences. Traders can select whether they wish to view data from the Northern or Southern Hemisphere, which adjusts the seasonal analysis accordingly. This customization ensures the data is relevant, no matter where in the world you are trading from.
Defining Season Types for More Precision
The indicator provides the option to choose between meteorological and astronomical seasons. Understanding the distinction can help traders correlate market performances with specific seasonal events:
-
Meteorological Seasons:
- Autumn: September to November
- Winter: December to February
- Spring: March to May
- Summer: June to August
-
Astronomical Seasons:
- Autumn: Begins at the equinox on September 22
- Winter: Starts from the solstice on December 21
- Spring: Starts at the equinox on March 20
- Summer: Commences from the solstice on June 21
Display Options for Optimized Analysis
Traders can tailor their view by choosing between two display modes: average returns by season for a broad overview, or raw returns by season and year for detailed analysis. This flexibility allows traders to customize their approach based on their specific needs or trading strategies.
Indicator Settings and Style Adjustments
The indicator offers several customizable settings to align with the trader's preferences and requirements:
- Max Seasons: Choose the maximum number of seasons to display, allowing for long-term or short-term analysis based on your strategy.
- Hemisphere Selection: Switch between the Northern and Southern Hemisphere for personalized data alignment.
- Season Type Selection: Toggle between ASTRONOMICAL or METEOROLOGICAL season types.
- Display Options: Decide whether to focus on all four seasons or narrow down the analysis to just one.
Customizable Style Features
- Bar Size & Autofit: Modify the size of the bars and toggle the autofit feature to maintain optimal chart aesthetics.
- Labels Size: Adjust the size of the labels for better clarity in presentation.
- Colors & Gradient Options: Easily set default colors for bullish and bearish returns, and enable or disable gradient features to highlight data trends visually.
FAQ
How can I access the Market Performance by Yearly Seasons Indicator?
You can get access on the LuxAlgo Library for charting platforms like TradingView, MetaTrader (MT4/MT5), and NinjaTrader for free.
Can this indicator be used for both short-term and long-term trading strategies?
Yes, the Market Performance by Yearly Seasons indicator can be customized to display data for both short-term and long-term seasonal analysis, making it versatile for various trading strategies.
Trading & investing are risky and many will lose money in connection with trading and investing activities. All content on this site is not intended to, and should not be, construed as financial advice. Decisions to buy, sell, hold or trade in securities, commodities and other investments involve risk and are best made based on the advice of qualified financial professionals. Past performance does not guarantee future results.
Hypothetical or Simulated performance results have certain limitations. Unlike an actual performance record, simulated results do not represent actual trading. Also, since the trades have not been executed, the results may have under-or-over compensated for the impact, if any, of certain market factors, including, but not limited to, lack of liquidity. Simulated trading programs in general are designed with the benefit of hindsight, and are based on historical information. No representation is being made that any account will or is likely to achieve profit or losses similar to those shown.
Testimonials appearing on this website may not be representative of other clients or customers and is not a guarantee of future performance or success.
As a provider of technical analysis tools and strategies, we do not have access to the personal trading accounts or brokerage statements of our customers. As a result, we have no reason to believe our customers perform better or worse than traders as a whole based on any content, tool, or platform feature we provide.
Charts used on this site are by TradingView in which the majority of our technical indicators are built on. TradingView® is a registered trademark of TradingView, Inc. www.TradingView.com TradingView® has no affiliation with the owner, developer, or provider of the Services described herein.
Market data is provided by CBOE, CME Group, BarChart, Massive, CoinAPI. Select U.S. equities data is provided through Massive. CBOE BZX real-time U.S. equities data is licensed from CBOE and provided through BarChart. Real-time futures data is licensed from CME Group and provided through BarChart. Select cryptocurrency data, including major coins, is provided through CoinAPI. All data is provided “as is” and should be verified independently for trading purposes.
This does not represent our full Disclaimer. Please read our full disclaimer.
© 2026 LuxAlgo Global, LLC.