Multi-Horizon Volatility Waterfall
![]() By LuxAlgoFeb 19, 2026
By LuxAlgoFeb 19, 2026
The Multi-Horizon Volatility Waterfall [LuxAlgo] is an advanced trading indicator designed to visualize market volatility as a dynamic, multi-layered spectrum across ten distinct time horizons. By applying percentile rank normalization to the Average True Range (ATR), this tool transforms raw volatility data into a standardized “heat map” that reveals volatility clusters, compression zones, and regime shifts. The result is a powerful trading strategy companion that helps traders anticipate breakouts, confirm trends, and adapt risk management based on real-time market conditions.
How to Trade the Multi-Horizon Volatility Waterfall?
Unlike traditional volatility indicators that rely on a single lookback period, the Multi-Horizon Volatility Waterfall stacks ten different ATR horizons—from fast micro-bursts to slow macro-structural shifts. This layered approach allows traders to see how volatility propagates across timeframes, often signaling institutional participation before price action fully reflects it.
By monitoring how volatility “flows” from fast to slow horizons, traders can identify early trend formation, exhaustion, or regime transitions between expansion and compression.
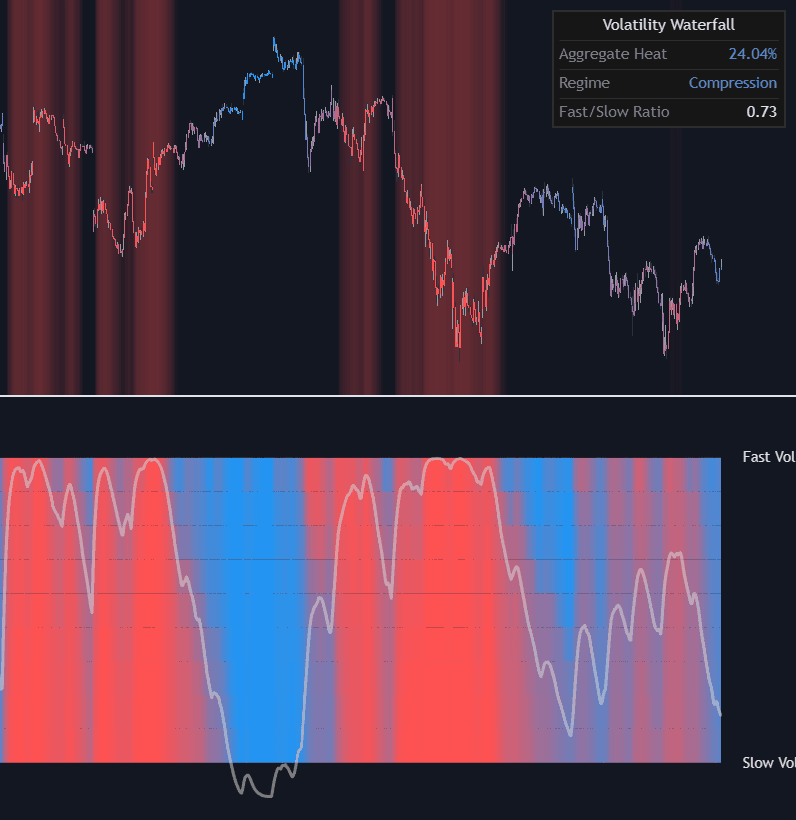
The Volatility Waterfall (Oscillator Pane)
The dedicated oscillator pane displays ten horizontal ribbons, each representing a unique volatility horizon.
- Hot (Red): Current volatility ranks in the highest percentiles relative to its historical range for that specific horizon. This signals expansion and heightened market participation.
- Cold (Blue): Volatility is historically compressed, suggesting consolidation or pre-breakout conditions.
- Aggregate Line: A central composite metric averaging all ten horizons. This serves as a primary market regime classifier, helping traders quickly identify whether the market is in Expansion, Neutral, or Compression mode.
This volatility spectrum acts as a trading heat map, allowing quick identification of structural changes in market behavior.
Main Chart Visual Enhancements
The indicator projects volatility data directly onto the price chart to improve decision-making in real time:
- Gradient Candles: Price candles dynamically change color based on the aggregate volatility heat. This enables instant recognition of high-volatility price action.
- Expansion Glow: A background highlight that intensifies when Aggregate Heat exceeds 70%. This visual cue signals aggressive volatility expansion and potential breakout conditions.
- Pro Dashboard: A real-time volatility analytics panel showing:
- Aggregate Heat (%)
- Regime Classification (Expansion, Neutral, Compression)
- Fast/Slow Volatility Ratio
These features transform the indicator from a simple oscillator into a full volatility trading system overlay.
Volatility-Based Trading Strategies
The Multi-Horizon Volatility Waterfall supports multiple trading strategies across different market environments.
Identifying Volatility Squeeze Breakouts
When all ten ribbons turn Cold (Blue), the market is in deep compression across every horizon. This typically precedes explosive breakout moves.
A shift where fast horizons turn Hot (Red) first often signals the early stages of volatility expansion. Traders can prepare for breakout entries before slower horizons confirm.
Trend Confirmation and Participation Analysis
Sustained trends require sustained volatility. In a strong trend:
- The waterfall should remain in the Neutral to Hot range.
- A drop to Cold across multiple horizons while price continues trending may indicate weakening participation or distribution.
This makes the indicator highly effective for filtering false breakouts and identifying trend exhaustion.
Volatility Clusters and Expansion Phases
When the Aggregate Heat exceeds 70%, the Expansion Glow activates. This signals an intense volatility regime where:
- Stop-losses may need to widen.
- Position sizing may need adjustment.
- Reward potential increases alongside risk.
Vertical alignment—where all ten horizons simultaneously turn red—indicates a volatility cluster. These moments often precede institutional-driven breakouts or high-momentum continuation moves.
Mean Reversion Opportunities
Extreme full-spectrum heat (all ribbons red) can signal climax conditions. If price approaches key resistance or support during maximum heat, the probability of short-term cooling or mean reversion increases.
This provides advanced traders with volatility-based reversal timing confirmation.
Technical Foundation: Percentile Rank Normalization
At its core, the Multi-Horizon Volatility Waterfall standardizes ATR using percentile ranking over a long-term lookback window (e.g., 200 bars).
Raw ATR values vary significantly across:
- Assets (crypto vs forex vs equities)
- Timeframes (5-minute vs daily charts)
- Market regimes
By converting ATR into a 0–100 percentile heat score, the indicator ensures cross-asset and cross-timeframe consistency. This normalization allows traders to objectively compare volatility states without being misled by absolute ATR values.
Volatility Flow Dynamics
One of the most powerful analytical features is volatility flow:
- Heat appearing first in fast horizons suggests short-term momentum ignition.
- When heat cascades downward into slower horizons, it confirms structural trend development.
- Failure for heat to propagate may signal false breakouts or short-lived moves.
This “waterfall effect” gives traders insight into whether volatility is transient or structural.
Settings Explained
Main Settings
- Base Horizon Step: Defines the spacing between the 10 volatility horizons. For example, a step of 10 produces horizons from 10 to 100 periods.
- Percentile Lookback: Determines the historical window used to compute percentile rank normalization.
- Smoothing: Applies EMA smoothing to reduce noise and produce cleaner volatility transitions.
Visualization Settings
- Cold/Hot Colors: Customize the volatility heat gradient.
- Color Candles by Volatility Heat: Toggle volatility-based candle coloring.
- Max Glow Intensity (%): Adjust the strength of the Expansion Glow to balance visibility with price clarity.
Dashboard Controls
- Show Dashboard: Enable or disable the real-time volatility analytics table.
- Position/Size: Modify the dashboard layout for optimal chart integration.
Why Use a Multi-Horizon Volatility Indicator?
Most trading indicators measure either momentum or volatility in isolation. The Multi-Horizon Volatility Waterfall combines both by:
- Tracking volatility across multiple timeframes simultaneously
- Standardizing data using percentile ranking
- Visualizing regime shifts in real time
- Enhancing breakout detection and trend confirmation
This makes it suitable for:
- Day trading
- Swing trading
- Crypto trading
- Forex trading
- Equity index analysis
FAQ
What makes the Multi-Horizon Volatility Waterfall different from a standard ATR indicator?
Standard ATR provides a single volatility reading. This indicator layers ten ATR horizons and normalizes them into percentile ranks, creating a structured volatility heat map and regime classifier.
Can this indicator be used for breakout trading?
Yes. Deep compression across all horizons often precedes explosive volatility expansion. Monitoring fast-horizon heat shifts provides early breakout signals.
Is this suitable for mean reversion strategies?
Absolutely. Extreme full-spectrum heat readings can indicate climax conditions and potential short-term reversals.
How do I access the Multi-Horizon Volatility Waterfall [LuxAlgo]?
You can get access on the LuxAlgo Library for charting platforms like TradingView, MetaTrader (MT4/MT5), and NinjaTrader for free.
Free indicator
Get free access to this indicator on the platforms below.
Unlock the entire LuxAlgo Library
Every indicator, every strategy, full charts, and complete access to Quant — our AI agent.