Peak Activity Range
![]() By LuxAlgoJun 1, 2026
By LuxAlgoJun 1, 2026
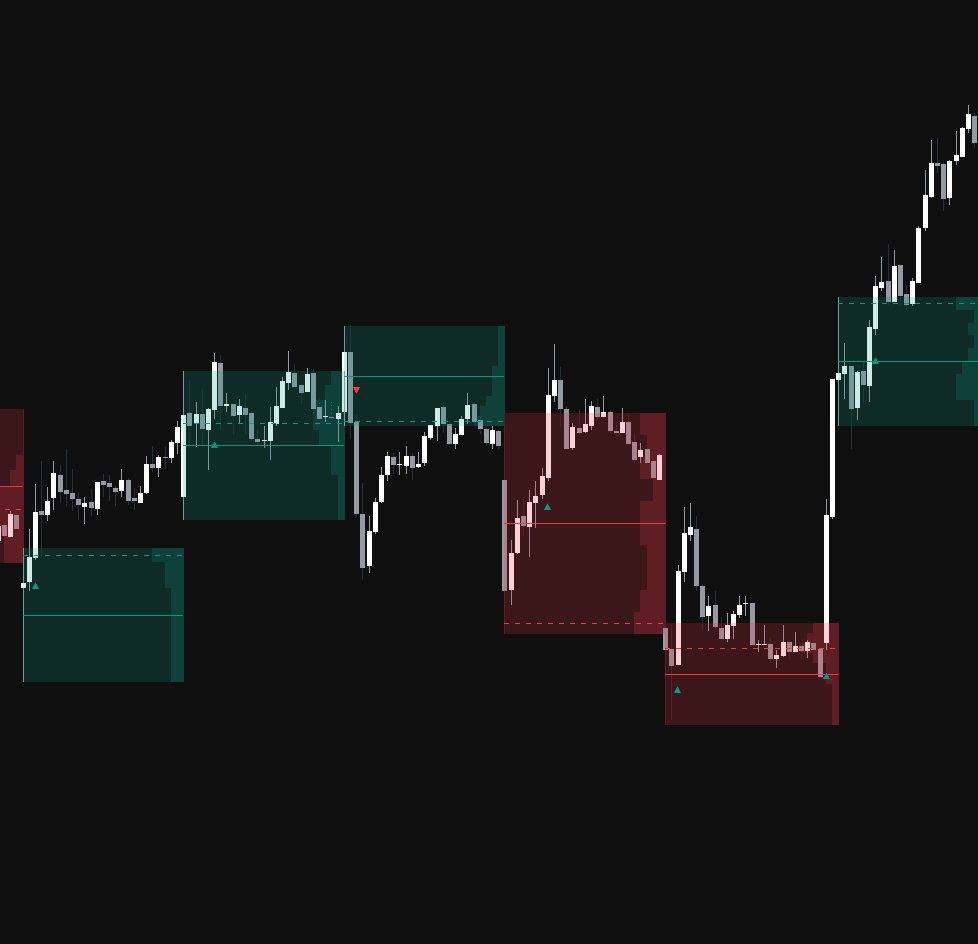
The Peak Activity Range indicator automatically detects high-volume price zones and turns them into actionable support and resistance ranges. By identifying volume spikes and mapping the high and low of the candle where major activity occurred, this trading indicator helps traders spot important market interest zones, analyze volume distribution, and monitor breakout or retest opportunities with clearer structure.
How to Trade the Peak Activity Range Indicator
The indicator identifies Peak Activity Ranges based on confirmed volume spikes. These ranges act as horizontal support and resistance zones where meaningful trading activity has taken place, often highlighting areas where large traders, institutions, or strong market participation may have influenced price.
Instead of relying only on basic price levels, the Peak Activity Range indicator combines price action with volume analysis. This helps traders understand not just where price reacted, but where the market showed unusually strong participation.
Traders can use these ranges to:
- Identify high-volume support and resistance zones
- Track potential breakout trading opportunities
- Watch for retests of important market levels
- Analyze where price may accept or reject a range
- Build a more structured volume-based trading strategy
Trading Signals and Signal Modes
The script plots small triangle signals (▲/▼) to highlight potential bullish or bearish entries based on the selected signal mode.
To reduce repeated or low-quality signals, the indicator uses state-based logic. After a signal appears, price must return to the solid average line before another signal can trigger in the same direction. This helps filter noisy price action and keeps signals focused around meaningful range interaction.
- Breakout: A bullish signal is triggered when price closes above the range high. A bearish signal is triggered when price closes below the range low. This mode is useful for traders looking for momentum continuation after price escapes a high-volume zone.
- Retest: A bullish signal is triggered when a candle opens below the range high but closes above it. A bearish signal is triggered when a candle opens above the range low but closes below it. This mode is useful for traders who prefer confirmation after price retests a key support or resistance boundary.
Breakout mode can help identify expansion moves, while Retest mode can help traders wait for price to confirm acceptance above or below a level before considering a trade.
Reading the Volume Distribution Profile
Within each Peak Activity Range, the indicator generates a dynamic Volume Profile. This profile is anchored to the right side of the zone and expands leftward, showing how much volume was transacted at specific price levels inside that range.
This makes the indicator useful for traders who want more context than a simple support and resistance box. The internal volume profile helps show where activity was concentrated, which can reveal important price levels inside the range.
A larger volume bar means more trading activity occurred at that price level. These areas can act as short-term magnets, reaction zones, or decision points depending on how price behaves around them.
How the Peak Activity Range Indicator Works
Volume Peak Detection
The script uses a pivot-based method to detect major volume highs. When a volume peak is confirmed after the selected Pivot Length, the indicator retroactively creates a range using the high and low of the candle that produced the volume spike.
Because the volume pivot requires confirmation, the range is created only after enough bars have passed. Any signals that occurred during the confirmation window are recalculated so the final chart remains accurate and consistent.
This approach helps the indicator focus on meaningful volume events rather than reacting to every small increase in market activity.
Internal Range Levels
Each Peak Activity Range contains two key internal levels designed to help traders interpret the zone more clearly:
- Solid Line: Represents the exact midpoint, or average, of the high-volume candle’s range. This can be viewed as a fair value level within the zone. Crossing this line resets the signal state, allowing new breakout or retest signals to form.
- Dashed Line: Represents the Point of Control (POC). This is the price level inside the range where the highest amount of volume was transacted, calculated from the internal volume profile.
The midpoint helps traders understand the balance area of the range, while the POC highlights the most active price level. Together, these levels can improve support and resistance analysis, breakout confirmation, and retest-based trading strategies.
Peak Activity Range Indicator Settings
General Settings
- Pivot Length: Controls the number of bars used to confirm a volume pivot high. Larger values identify more significant, longer-term activity ranges, while smaller values create more frequent zones.
- Signal Mode: Allows traders to switch between Breakout and Retest logic for triangle signals.
Volume Profile Settings
- Show Volume Profile: Toggles the visibility of the internal volume distribution bars.
- Profile Rows: Controls the vertical detail of the Volume Profile by changing the number of price bins used inside the range.
- Max Width %: Controls the maximum horizontal extension of the profile as a percentage of the range duration.
Style Settings
- Bullish/Bearish Fill: Adjusts the colors for the range background and volume profile bars.
- Bullish/Bearish Lines: Adjusts the colors for the solid average line and dashed POC line.
- Signal Colors: Customizes the colors for upward and downward breakout or retest triangle signals.
Why Use the Peak Activity Range Indicator?
The Peak Activity Range indicator is designed for traders who want to combine volume analysis, support and resistance, and breakout detection into one visual trading tool.
By focusing on candles with significant volume peaks, the indicator highlights price zones where the market has shown strong participation. These zones can become important reference points for future price action, especially when price returns to test the range high, range low, midpoint, or Point of Control.
This makes the indicator useful for:
- Breakout trading strategies
- Retest trading strategies
- Support and resistance analysis
- Volume profile analysis
- Market structure confirmation
- Identifying high-interest price zones
Because the tool combines volume peaks with dynamic range mapping, traders can better understand where important market activity occurred and how price is reacting to those levels over time.
FAQ
What is the Peak Activity Range indicator?
The Peak Activity Range indicator is a volume-based trading indicator that detects high-volume candles and creates support and resistance ranges from those areas. It also includes an internal Volume Profile, midpoint line, Point of Control, and breakout or retest signals.
How can traders use Peak Activity Ranges?
Traders can use Peak Activity Ranges to identify important support and resistance zones, monitor breakout signals, watch for retests, and analyze where volume was concentrated within a specific price range.
What is the difference between Breakout and Retest mode?
Breakout mode signals when price closes outside the range high or range low. Retest mode signals when price crosses and confirms back through a range boundary, helping traders look for confirmation after price interacts with support or resistance.
What does the dashed line represent?
The dashed line represents the Point of Control, or POC. This is the price level inside the range where the most volume was traded according to the internal Volume Profile.
How do I access the Peak Activity Range indicator?
You can get access on the LuxAlgo Library for charting platforms like TradingView, MetaTrader (MT4/MT5), and NinjaTrader for free.
Free indicator
Get free access to this indicator on the platforms below.
Unlock the entire LuxAlgo Library
Every indicator, every strategy, full charts, and complete access to Quant — our AI agent.