Range Intelligence Suite
![]() By LuxAlgoFeb 19, 2026
By LuxAlgoFeb 19, 2026
The Range Intelligence Suite is an advanced trading indicator designed to detect market consolidation zones using ATR-based volatility logic and enhance them with a delta-coded volume profile and real-time dashboard analytics. This trading tool helps traders identify price ranges, understand internal accumulation or distribution dynamics, and anticipate potential breakout opportunities with greater precision.
How to Trade the Range Intelligence Suite Trading Indicator?
The Range Intelligence Suite focuses on one of the most powerful trading environments: consolidation. Markets spend a significant portion of time moving sideways before expanding into strong trends. This indicator helps traders systematically identify these compression phases and analyze the underlying volume structure to forecast breakout direction.
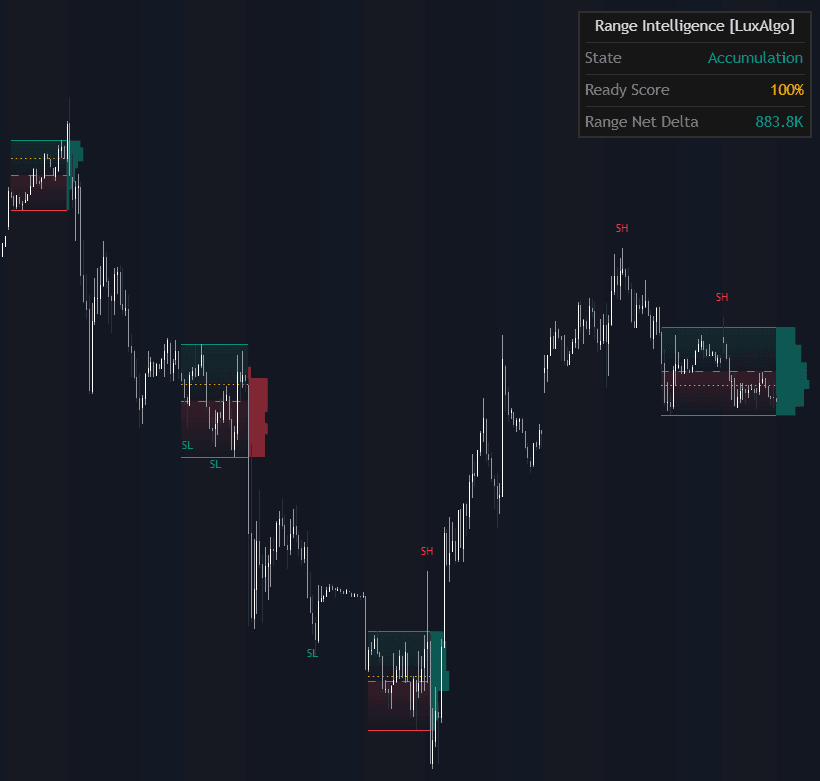
When price enters a consolidation phase, the indicator automatically:
- Draws a dynamic range box around the price structure.
- Displays a mid-line to visualize equilibrium.
- Applies gradient shading to highlight the active consolidation.
- Generates a right-aligned Volume Profile for that range.
- Tracks real-time Net Delta and range maturity through an on-chart dashboard.
Instead of simply showing support and resistance, this trading strategy tool reveals the internal battle between buyers and sellers within the range.
Understanding Consolidation and Breakout Potential
A consolidation phase reflects market indecision, where neither buyers nor sellers have full control. The tighter the compression, the more powerful the eventual expansion can be.
The Range Intelligence Suite identifies these zones early and tracks:
- How long the range has been forming.
- Whether volume is accumulating (bullish bias).
- Whether volume is distributing (bearish bias).
- Whether liquidity sweeps are occurring before a breakout.
This makes it highly effective for breakout traders, mean reversion traders, and volume-based strategy developers.
Liquidity Sweeps
The indicator automatically highlights “Fakeouts” or Liquidity Sweeps using labels.
These events occur when:
- Price briefly breaks above the range high but closes back inside.
- Price briefly breaks below the range low but closes back inside.
This behavior often represents a stop-run, where liquidity is grabbed before price reverses or prepares for a true breakout. Identifying these traps gives traders a significant edge in anticipating reversals or explosive continuation moves.
Delta-Coded Volume Profile
Unlike a traditional volume profile, the Range Intelligence Suite integrates Net Delta directly into the profile coloring.
- A bullish profile signals accumulation (buy volume exceeding sell volume).
- A bearish profile signals distribution (sell volume exceeding buy volume).
This delta-coded visualization allows traders to immediately understand whether the range is being built by strong buyers or aggressive sellers — a critical component for directional bias in breakout trading strategies.
Indicator Mechanics and Technical Breakdown
Range Detection Mechanism
The Range Intelligence Suite uses a volatility-based model to detect consolidation.
It calculates:
- Highest High over a user-defined Detection Length.
- Lowest Low over the same period.
- Average True Range (ATR) as a volatility benchmark.
A range is triggered when: Range Width < ATR × Range Sensitivity
In simple terms, if price movement compresses into a vertical space smaller than what volatility normally suggests, the indicator identifies a consolidation zone.
The range remains active until a candle closes outside its boundaries, signaling a potential breakout and the end of that structure.
This ATR-based approach ensures the indicator adapts across assets including stocks, crypto, forex, and futures.
Volume Profile Structure
For each detected range, a right-aligned Volume Profile is plotted to reveal:
- High-volume nodes (areas of acceptance).
- Low-volume voids (areas of rejection).
- Point of Control (POC) — the price level with the highest traded volume.
This structural insight helps traders:
- Identify fair value areas.
- Anticipate magnet zones.
- Target breakout expansion areas.
- Position trades around institutional interest levels.
Real-Time Dashboard Intelligence
The integrated dashboard transforms the indicator into a complete trading decision system.
Dashboard Metrics
- State: Displays whether the current environment reflects Accumulation, Distribution, or Trend Scan mode.
- Ready Score: A percentage-based metric combining range duration and Net Delta intensity. Higher values indicate a mature consolidation potentially ready for expansion.
- Range Net Delta: The cumulative difference between buying and selling volume since the start of the range.
This real-time feedback enables traders to quantify breakout probability instead of relying solely on visual judgment.
How to Configure the Range Intelligence Suite
Intelligence Core
- Detection Length: Controls how far back the indicator scans to identify a range.
- Range Sensitivity: ATR multiplier determining how tight price must compress to trigger a range. Lower values detect tighter consolidations.
- Hide Overlapping Ranges: Displays only the most relevant structure when multiple ranges form.
Visual UX Customization
- Bullish/Bearish Colors: Customize range and profile color themes.
- Fill Transparency: Adjust opacity for cleaner chart visibility.
- Show Point of Control (POC): Enables the gold dotted POC line.
- Highlight Liquidity Sweeps: Toggles fakeout labels.
Volume Profile Settings
- Show Volume Profile: Enables the histogram visualization.
- Rows: Controls vertical resolution of volume bins.
- Profile Max Width: Defines how far the profile extends relative to range duration.
Dashboard Settings
- Dashboard Toggle: Enable or disable the on-chart data panel.
- Position/Size: Customize placement and scaling for optimal chart layout.
Why This Trading Indicator Stands Out
The Range Intelligence Suite is more than a consolidation detector. It combines:
- Volatility compression logic (ATR-based detection)
- Structural volume analysis (Volume Profile)
- Order flow bias (Net Delta)
- Liquidity trap detection (Sweeps)
- Quantified breakout readiness (Ready Score)
This fusion makes it a powerful tool for:
- Breakout trading strategies
- Smart money concept traders
- Volume profile traders
- Range trading systems
- Crypto, forex, stock, and futures traders
FAQ
What is the Range Intelligence Suite best used for?
It is best used for identifying consolidation zones and preparing for high-probability breakout trades using volume and delta confirmation.
Can this trading indicator be used on any asset?
Yes. The ATR-based logic adapts across different markets including stocks, cryptocurrencies, forex pairs, and futures.
How do I access the Range Intelligence Suite?
You can get access on the LuxAlgo Library for charting platforms like TradingView, MetaTrader (MT4/MT5), and NinjaTrader for free.
Is this suitable for beginners?
Yes. While the indicator provides advanced analytics like delta and volume profiling, the visual structure and dashboard simplify complex market dynamics into actionable insights.
Free indicator
Get free access to this indicator on the platforms below.
Unlock the entire LuxAlgo Library
Every indicator, every strategy, full charts, and complete access to Quant — our AI agent.