Reversal Probability Rows
![]() By LuxAlgoFeb 16, 2026
By LuxAlgoFeb 16, 2026
The Reversal Probability Rows trading indicator is a statistical price action tool designed to identify high-probability reversal zones using historical pivot data. By segmenting price into structured horizontal levels and calculating the distribution of past tops and bottoms, this indicator transforms raw market structure into actionable probabilities. Traders can use it as a data-driven support and resistance strategy to anticipate potential bullish or bearish reversals with quantified confidence.
Unlike traditional support and resistance tools that rely on visual interpretation, this trading indicator applies a systematic probability model to historical pivot highs and pivot lows. The result is a clean, objective framework for identifying where price is statistically more likely to reverse.
How to Trade the Reversal Probability Rows Indicator?
This trading strategy works by dividing the price range of a selected lookback period into evenly spaced horizontal rows. Each row becomes a statistical zone, measuring how often price historically formed tops or bottoms within that area.
Instead of guessing where reversals might happen, traders can rely on quantified probabilities derived from pivot point clustering.
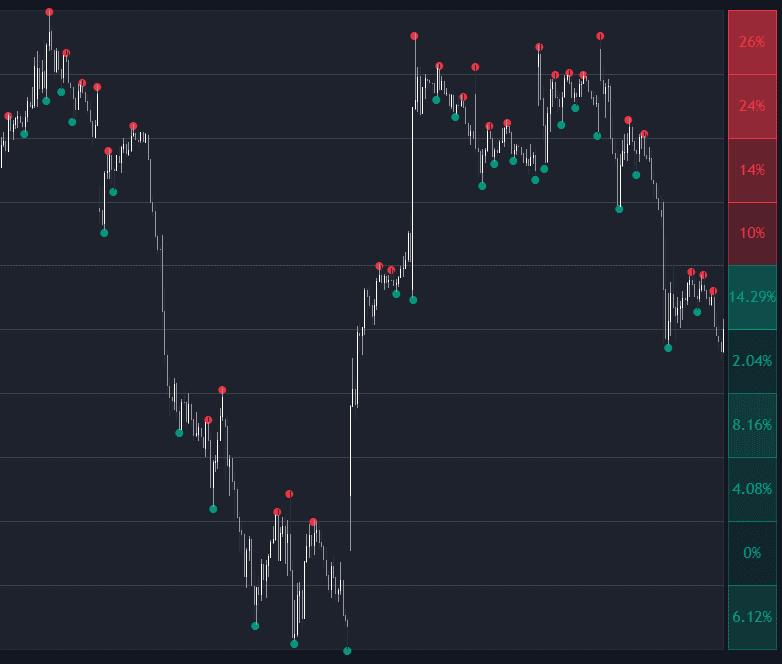
The probability boxes displayed to the right of price represent the likelihood of a reversal at each level based on historical data.
Bearish Reversal Zones (Red Boxes)
When price is trading below a row, that level is treated as potential resistance.
The percentage displayed in the red box represents:
- The number of historical Pivot Highs within that row
- Divided by the total number of Pivot Highs in the entire lookback period
This gives a statistical probability of a bearish reversal if price revisits that zone.
Higher percentages indicate that the level has historically produced more tops, increasing the likelihood of supply entering the market again.
This makes the indicator particularly useful for:
- Short setups near statistically dense resistance
- Scaling out of long positions
- Identifying profit-taking areas in bullish trends
Bullish Reversal Zones (Green Boxes)
When price is trading above a row, that level is treated as potential support.
The green percentage represents:
- The number of historical Pivot Lows within that row
- Divided by the total number of Pivot Lows in the lookback period
This shows the probability of a bullish reversal at that level.
Zones with higher probabilities indicate historically strong demand, making them ideal for:
- Long entries on pullbacks
- Stop placement logic
- Identifying areas of accumulation
Current Price Row Analysis
When price is actively trading inside a specific row, the indicator compares the historical distribution of tops and bottoms within that zone.
It then:
- Displays the dominant reversal type
- Colors the box accordingly (Red = more tops, Green = more bottoms)
This allows traders to instantly assess whether the current zone historically behaved as resistance or support.
Statistical Framework Behind the Indicator
The tool operates using a structured, distribution-based probability model rather than subjective drawing.
First, the script defines the full price range using:
- The highest high within the lookback period
- The lowest low within the lookback period
This range is divided into equidistant rows based on the selected resolution.
It then scans the lookback window for pivot highs and pivot lows using the chosen Pivot Sensitivity.
The core formula is:
Probability % = (Number of Pivots of Type X in Row / Total Number of Pivots of Type X in Lookback) * 100
This approach ensures that probabilities are normalized and relative to the entire pivot distribution, creating a true statistical context for each level.
Visual Weighting and Zone Strength
The opacity (transparency) of each box is tied to pivot density:
- Rows with higher pivot frequency appear more solid
- Rows with lower frequency appear more transparent
This creates a visual heatmap effect, helping traders instantly identify the most structurally significant zones.
Indicator Settings Explained
The Reversal Probability Rows trading indicator offers flexible configuration for different markets and trading styles.
Calculation Settings
-
Range Period: Defines how many historical bars are used to determine the high/low range and gather pivot statistics. Larger values create broader structural context; smaller values adapt faster to current market conditions.
-
Number of Rows: Controls the vertical granularity of the analysis.
- More rows = narrower, more precise zones
- Fewer rows = broader, macro-level support and resistance areas
-
Pivot Sensitivity: Determines how many bars must exist on each side of a high or low for it to qualify as a pivot.
- Lower sensitivity = more pivots, more reactive data
- Higher sensitivity = fewer pivots, stronger structural turning points
Visualization Settings
-
Show Pivot Markers: Displays “•” markers for each historical pivot used in the statistical calculation, allowing traders to verify the raw data visually.
-
Box Width (Bars): Adjusts how far the probability boxes extend to the right of current price.
-
Row Highlight Color: Customizes the appearance of the calculation grid, improving chart clarity and alignment with your trading layout.
Why Use a Probability-Based Reversal Indicator?
Most support and resistance trading strategies rely on subjective drawing. This indicator removes that subjectivity by:
- Using objective pivot detection
- Normalizing reversal frequency
- Displaying quantifiable probabilities
- Providing structured zone segmentation
It works particularly well for:
- Mean reversion trading
- Range-bound markets
- Swing trading setups
- Risk-to-reward optimization
- Confluence with other LuxAlgo tools
Because it is distribution-based, the indicator adapts dynamically as new pivots form and old data rolls out of the lookback window.
Frequently Asked Questions (FAQ)
What makes this different from traditional support and resistance?
Traditional support and resistance tools rely on manual drawing or recent highs and lows. The Reversal Probability Rows indicator uses historical pivot distribution to calculate statistical reversal probabilities, making it more objective and data-driven.
Does this repaint?
The pivot detection depends on confirmed pivot formation (based on the Pivot Sensitivity setting). Once pivots are confirmed, their statistical contribution remains consistent within the selected lookback window.
What markets does this trading indicator work best on?
It works across stocks, crypto, forex, and futures. It is especially effective in markets that respect structured swing highs and swing lows.
How to access Reversal Probability Rows?
You can get access on the LuxAlgo Library for charting platforms like TradingView, MetaTrader (MT4/MT5), and NinjaTrader for free.
Free indicator
Get free access to this indicator on the platforms below.
Unlock the entire LuxAlgo Library
Every indicator, every strategy, full charts, and complete access to Quant — our AI agent.