RSI Divergence: Out-of-Sample Optimizer
![]() By LuxAlgoJun 9, 2026
By LuxAlgoJun 9, 2026
The RSI Divergence: Out-of-Sample Optimizer indicator is a comprehensive backtesting and optimization tool designed to identify the most effective RSI period for trading price-RSI divergences within a specified historical window and validate those results through out-of-sample and forward testing.
USAGE
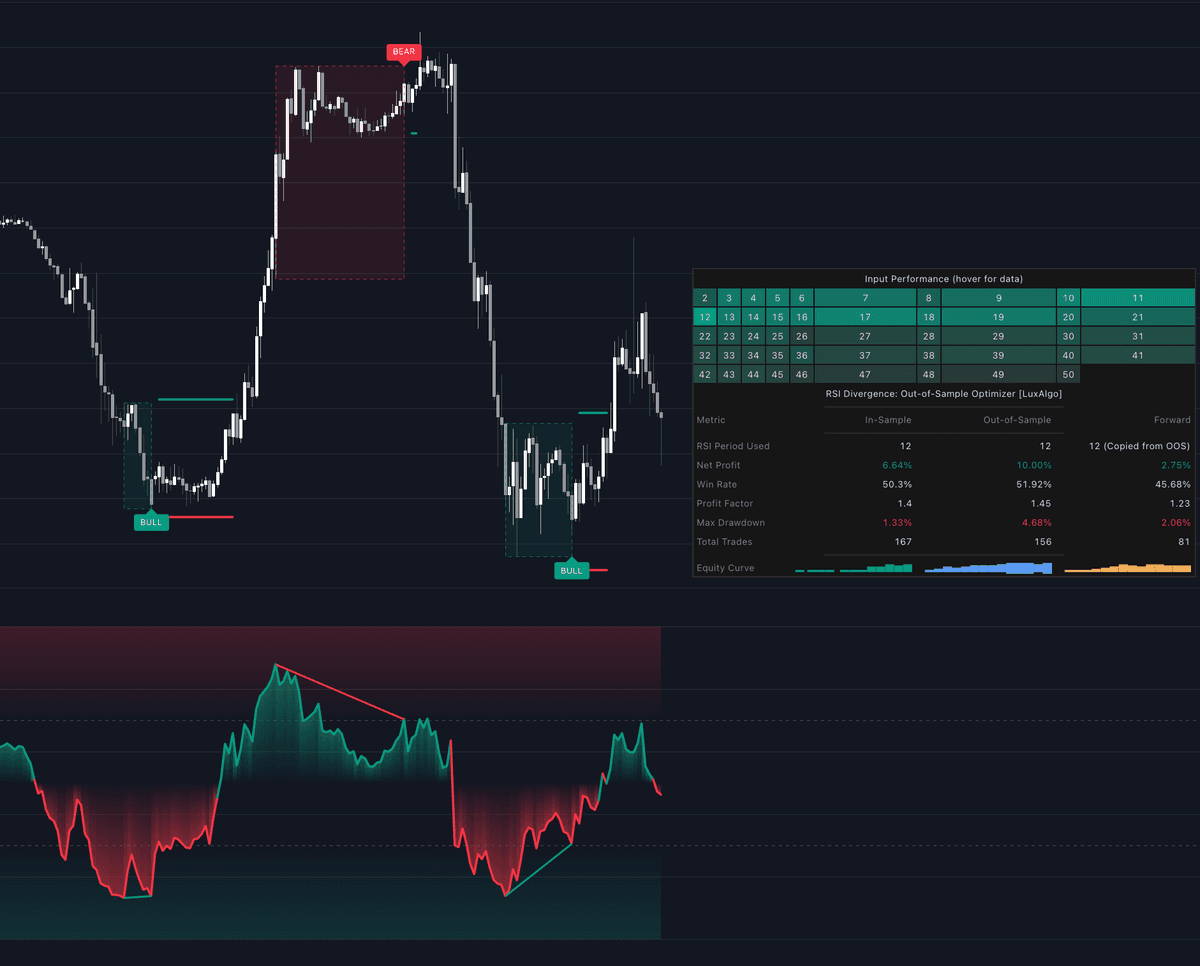
The script is divided into three distinct chronological phases to simulate a professional quantitative workflow:
In-Sample (IS) Optimization
During this period (highlighted by the first background gradient), the script simulates dozens of RSI periods simultaneously. It calculates divergence signals and trade outcomes for every period within the user-defined range (e.g., RSI 2 to 50). The "best" period is selected based on your chosen Optimization Metric, such as Net Profit or Profit Factor.
Out-of-Sample (OOS) Validation
Once the best RSI period is identified in the IS phase, the script "locks" that parameter and applies it to the next segment of data (the OOS period). This tests whether the strategy’s performance was due to genuine market alpha or simply "curve-fitting" to historical noise.
Forward Testing
The Forward period represents the most recent data leading up to the current bar. The script continues using the parameter validated during the OOS phase to show how the strategy is performing in the current market environment.
DETAILS
Divergence Detection
The script identifies regular bullish and bearish divergences. A bullish divergence occurs when price makes a lower low while the RSI makes a higher low. A bearish divergence occurs when price makes a higher high while the RSI makes a lower high. The script uses pivot lookback settings to confirm these peaks and troughs.
Trade Execution Logic
Trades are entered on the bar following a confirmed divergence. Stop loss and take profit levels are calculated using an ATR (Average True Range) multiplier to account for market volatility. Users can also enable "Exit on Opposite Signal" to close trades if a contrary divergence appears before hitting a price target.
Sensitivity Analysis (Heatmap)
The dashboard includes a "Sensitivity Table" that acts as a heatmap. It displays every RSI period tested during the In-Sample phase. Darker green cells indicate superior performance, while darker red cells indicate poorer performance based on the selected optimization metric. This allows you to see if your "best" setting is an outlier or part of a robust cluster of profitable periods.
SETTINGS
Optimization & Backtest Ranges
- In-Sample Start/End: Defines the historical window used to find the best performing RSI period.
- Out-of-Sample Start/End: Defines the validation window where the best IS period is tested on unseen data.
- Min/Max RSI Period: The range of RSI lengths the script will simulate (e.g., 2 to 50).
- Optimization Metric: The primary KPI used to rank RSI periods (e.g., Sharpe Ratio, Win Rate, Net Profit).
Divergence Settings
- Pivot Left/Right Bars: The number of bars required on either side of a point to confirm a local high or low in the RSI.
- Max Divergence Bars: The maximum distance allowed between two pivots to qualify as a divergence.
Trade Rules
- Stop Loss/Take Profit ATR Multiplier: Controls the distance of exit levels based on recent volatility.
- Exit on Opposite Signal: When enabled, a long trade will close immediately if a bearish divergence is detected.
Dashboard
- Extra Dashboard Metric 1/2: Allows you to add two additional performance statistics to the dashboard (e.g., Z-Score or Average Trade) alongside the default metrics.
- Dashboard Position/Size: Adjusts the UI elements to fit your screen resolution and preference.
Free indicator
Get free access to this indicator on the platforms below.
Unlock the entire LuxAlgo Library
Every indicator, every strategy, full charts, and complete access to Quant — our AI agent.