Rubber Band Liquidity Signals
![]() By LuxAlgoJun 15, 2026
By LuxAlgoJun 15, 2026
The Rubber Band Liquidity Signals indicator identifies high probability market opportunities by detecting liquidity sweeps occurring after distinct periods of trend and consolidation. This tool assists traders in filtering out market noise and pinpointing setups where institutional players likely engage in stop hunting before continuing the primary trend.
Usage
The Rubber Band Liquidity Signals indicator operates on a specific market cycle model: Trend, Consolidation, Liquidity Sweep, and Continuation. By identifying these stages, it provides visual cues to help traders anticipate potential breakouts.
Identifying Market Ranges
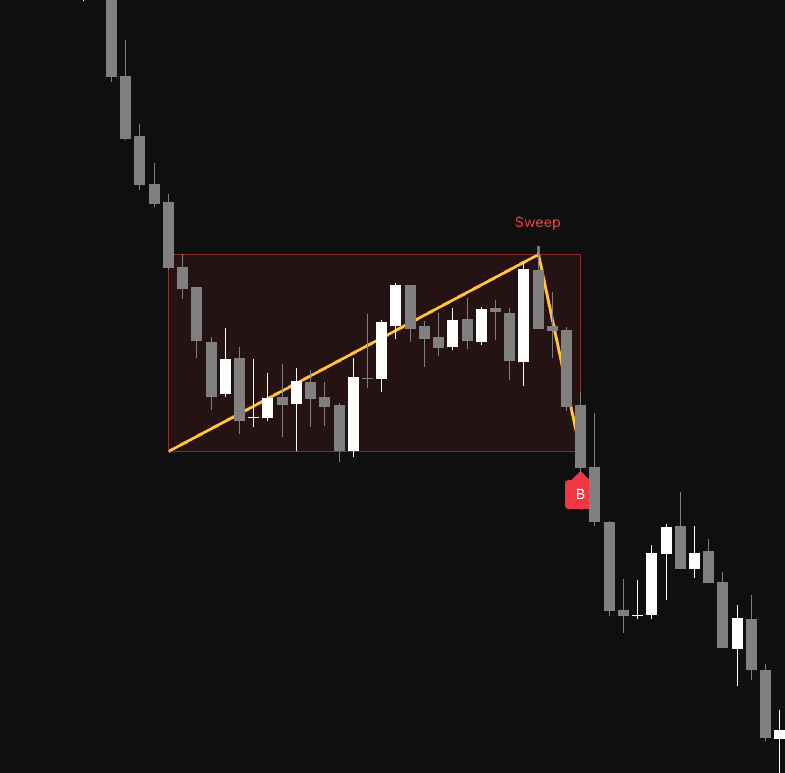
The indicator automatically draws a box when it detects a period of consolidation following a strong trend. The Bullish Color represents a consolidation after an uptrend, while the Bearish Color represents a consolidation after a downtrend. These boxes visualize the price range that the market is currently testing.
Interpreting Signals
- Liquidity Sweep: When the price penetrates the range high or low but closes back inside the range, the indicator identifies a liquidity sweep. A line is drawn to highlight this grab, indicating that market participants are likely being cleared out of their positions.
- Continuation Signal: Following a confirmed sweep, if the price breaks out of the range in the direction of the initial trend, the indicator plots a "B" label and a yellow V shape. This signals that the market has likely finished its "rubber band" compression and is ready to continue the primary trend.
Details
The logic behind the Rubber Band Liquidity Signals tool relies on volatility metrics, specifically the Average True Range (ATR), to ensure that the trend and consolidation phases are calculated based on current market conditions rather than static price levels.
The script measures the move size over a lookback period to confirm the strength of the preceding trend. If the price remains within a specific ATR multiplier width for a set number of bars, the consolidation phase is defined. The core strength of the indicator is its ability to differentiate between a simple range breakout and a liquidity sweep. By requiring the price to close back within the range after piercing it, the script effectively filters out false breakouts that often trap retail traders. The final yellow V shape serves as a visual confirmation of the price snapping back into the primary trend direction.
Settings
Trend & Range Settings
- Trend Lookback: Determines the number of bars used to calculate the strength of the preceding trend.
- Trend Move ATR Multiplier: Sets the minimum price move size relative to the ATR to validate a strong trend.
- Consolidation Length: Defines the number of bars required to form a consolidation range.
- Range Max ATR Multiplier: Sets the maximum allowed width of the consolidation range.
- Max Range Duration: Limits the duration of the consolidation box to prevent stale signals.
Style
- Bullish Color: Customizes the visual color of bullish ranges and sweep markers.
- Bearish Color: Customizes the visual color of bearish ranges and sweep markers.
FAQ
How do I access Rubber Band Liquidity Signals? You can get access on the LuxAlgo Library for charting platforms like TradingView, MetaTrader (MT4/MT5), and NinjaTrader for free.
Free indicator
Get free access to this indicator on the platforms below.
Unlock the entire LuxAlgo Library
Every indicator, every strategy, full charts, and complete access to Quant — our AI agent.