TICK Arbitrage Toolkit
 By LuxAlgoFeb 18, 2026
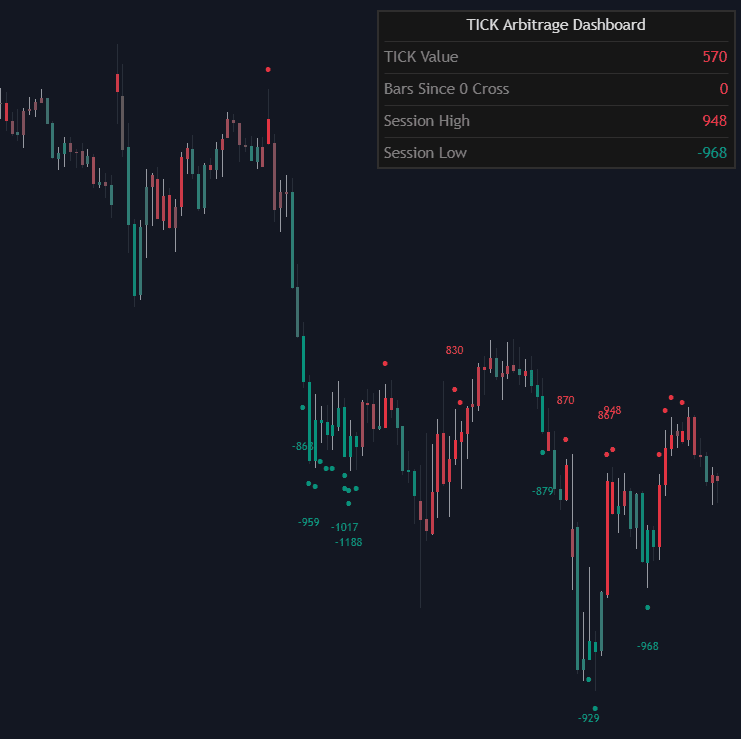
The TICK Arbitrage Toolkit is a professional-grade trading indicator built to monitor real-time market breadth using NYSE TICK and NASDAQ TICKQ data. Designed for index scalpers and mean reversion traders, this tool visualizes internal buying and selling pressure directly on your price chart, helping you identify high-probability reversal zones and short-term arbitrage opportunities in indices like the S&P 500 and Nasdaq 100.
By mapping TICK extremes onto price bars with dynamic color gradients and extension markers, the toolkit allows traders to quickly interpret internal sentiment shifts without relying on a separate indicator pane. This makes it an efficient trading strategy companion for those who rely on market internals to time entries and exits.
How to Trade the TICK Arbitrage Toolkit?
This trading indicator is built around identifying internal exhaustion points where market breadth reaches statistically extreme levels. When TICK readings extend into predefined thresholds, they often signal short-term overbought or oversold conditions that can precede price reversals.
The toolkit defines three extension levels to help traders categorize the intensity of the internal move. These levels can be used to anticipate:
- Short-term exhaustion in strong directional pushes
- Liquidity grabs during trend extensions
- Mean reversion setups after internal blow-offs
- Scalping opportunities during intraday extremes
Instead of forcing traders to interpret raw TICK values in a separate window, the indicator integrates the data directly onto price bars. A color gradient increases in intensity as internal pressure builds, allowing you to visually gauge momentum shifts in real time.
This makes the tool particularly effective for:
- Index scalping strategies
- Intraday mean reversion trading
- Short-term reversal confirmation
- Market breadth confirmation during breakouts
Extension Levels and Arbitrage Intensity
The core of this trading indicator revolves around three configurable extension levels (default: 800, 1000, 1200). These thresholds classify how extreme the internal imbalance is.
-
Extension 1:
Displays a single marker and initiates tracking for potential new session highs or lows. This level signals early internal expansion and the beginning of potential exhaustion. -
Extension 2:
Displays two vertical markers, indicating growing internal pressure. At this stage, traders begin preparing for potential fade setups or tightening risk. -
Extension 3:
Displays three vertical markers and reaches maximum color opacity. This represents a full internal extreme and signals a potential high-probability arbitrage or mean reversion opportunity.
The stronger the extension, the more stretched the internal breadth becomes. Many professional traders use these extremes to fade price spikes when liquidity becomes one-sided.
Session High and Low Tracking for Institutional Context
The TICK Arbitrage Toolkit automatically tracks session-based internal extremes.
When a New High of Day (NHOD) or New Low of Day (NLOD) occurs in the selected TICK source, the indicator prints a professional label on the chart. This provides additional confirmation when:
- Internal breadth is breaking to new extremes
- Price is testing key intraday structure
- Momentum shifts align with internal expansion
Tracking NHOD and NLOD is critical for understanding whether a move is expanding participation or simply exhausting into a final push.
How the Indicator Processes Real-Time Market Data
One of the most powerful features of this trading tool is its ability to operate at a higher resolution than the visible chart timeframe.
Refresh Frequency for Intrabar Precision
The Refresh Frequency setting allows the script to sample internal data at sub-minute intervals such as 1-second or 5-second resolution. This means the indicator can detect internal spikes that occur within a single chart bar.
For scalpers and short-term traders, this provides:
- Faster detection of internal surges
- Early recognition of exhaustion
- Improved timing for entries and exits
This makes the toolkit especially useful during volatile sessions when TICK values can spike rapidly.
Capturing True Market Stress with High/Low Extremes
When Include High/Low Extremes is enabled, the indicator evaluates the highest and lowest TICK values within the sampling window instead of relying solely on closing values.
This ensures:
- Brief but significant intrabar spikes are not missed
- True market stress is captured
- Internal extremes are measured accurately
This feature enhances the reliability of the extension levels, particularly during fast-moving market conditions.
Indicator Settings Explained
Settings
-
TICK Source:
Choose between NYSE TICK (ideal for S&P 500 analysis) or NASDAQ TICKQ (ideal for Nasdaq 100 analysis). -
Refresh Frequency:
Controls how often the internal data is sampled. Lower values increase intrabar detail and responsiveness. -
Include High/Low Extremes:
When enabled, uses the absolute highest or lowest TICK value within the sampling window to capture spikes. -
Extension 1, 2, 3:
Customizable numeric thresholds that define arbitrage intensity levels and internal extremes.
Style Customization
-
Positive TICK Color:
Color for positive internal readings, often associated with overbought or reversal zones. -
Negative TICK Color:
Color for negative internal readings, typically associated with oversold or reversal zones. -
Marker Style:
Choose between Circles, Triangles, or None to customize how extension levels appear on the chart.
Dashboard Controls
-
Dashboard:
Toggle the on-screen data table for quick reference to internal values and session statistics. -
Position:
Move the dashboard to different corners of the chart for optimal visibility. -
Size:
Adjust the dashboard’s scale to match your chart layout.
Why Use TICK Internals in Your Trading Strategy?
Market internals like NYSE TICK and NASDAQ TICKQ measure the number of stocks trading on an uptick versus a downtick at any given moment. Extreme readings often coincide with liquidity imbalances and short-term exhaustion.
By integrating this breadth data directly into price action:
- You reduce noise from lagging indicators
- You gain institutional-level context
- You identify high-probability mean reversion setups
- You enhance precision for index scalping
The TICK Arbitrage Toolkit transforms raw internal data into actionable visual signals, making it a powerful trading indicator for active traders.
FAQ
What is the TICK Arbitrage Toolkit best used for?
It is best used for index scalping, mean reversion trading, and identifying short-term reversal zones using market breadth data from NYSE TICK or NASDAQ TICKQ.
Does this indicator work on all timeframes?
Yes. It can be applied to any timeframe, but it is especially powerful on lower timeframes where internal extremes often produce rapid reversals.
How does the extension system improve trading accuracy?
The three-level extension system helps categorize the intensity of internal pressure. Stronger extensions often correspond to higher probability exhaustion points.
How do I access the TICK Arbitrage Toolkit?
You can get access on the LuxAlgo Library for charting platforms like TradingView, MetaTrader (MT4/MT5), and NinjaTrader for free.
Free indicator
Get free access to this indicator on the platforms below.

Unlock the entire LuxAlgo Library
Every indicator, every strategy, full charts, and complete access to Quant — our AI agent.